## Line Graphs: ξ vs Time for Different K_s Values
### Overview
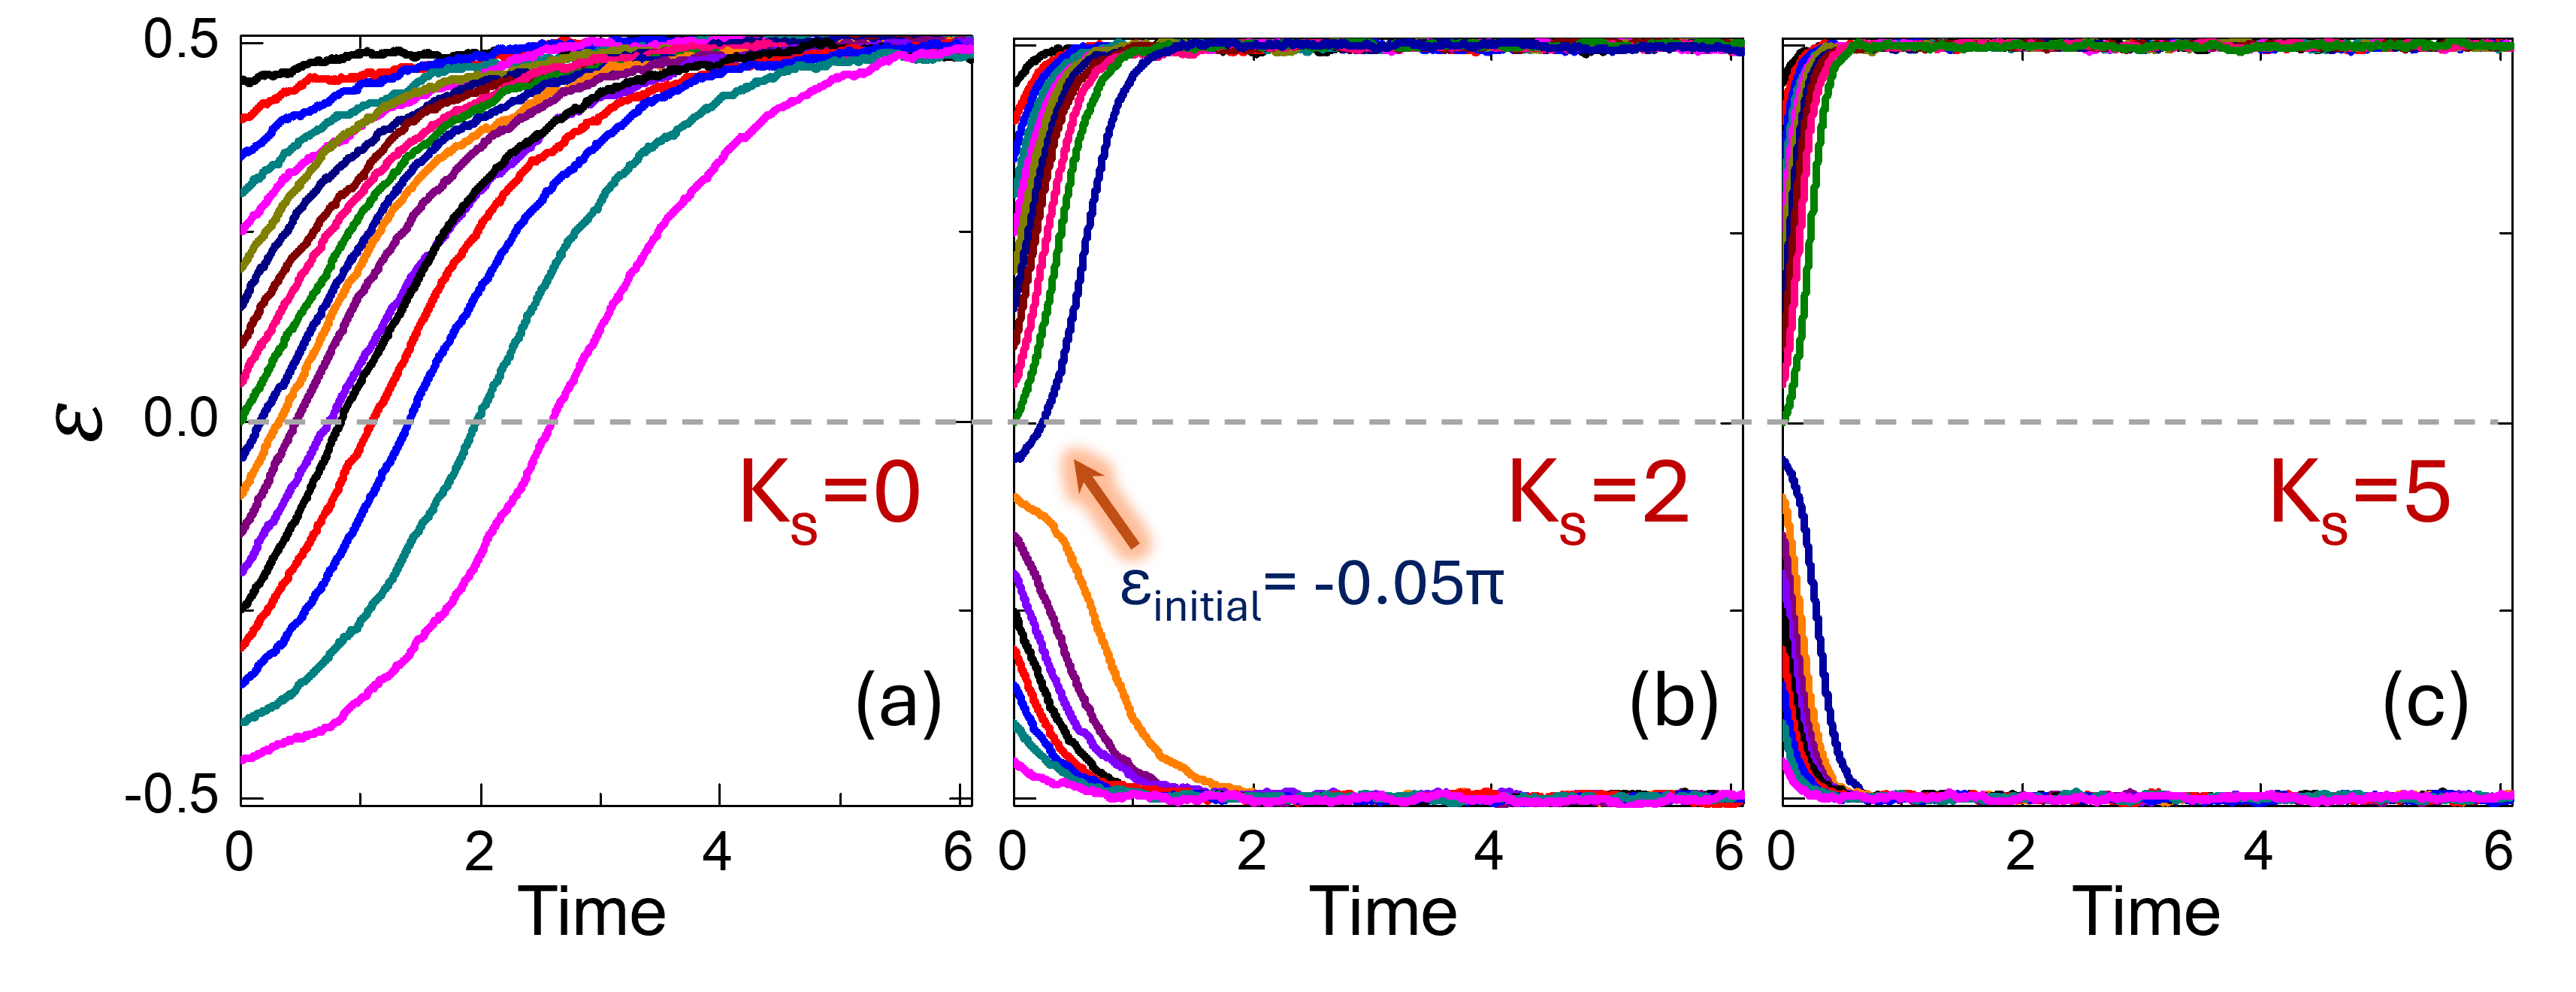
Three panels (a, b, c) display the evolution of ξ over time (0–6) for distinct stiffness constants (K_s = 0, 2, 5). Each panel shows multiple colored lines representing different initial conditions or parameters, converging toward ξ = 0 (dashed gray line).
### Components/Axes
- **X-axis**: Time (0–6), labeled "Time" in black.
- **Y-axis**: ξ (ranging from -0.5 to 0.5), labeled "ξ" in black.
- **Legend**: Located on the right side of each panel, mapping colors to K_s values (e.g., red = K_s=0, blue = K_s=2, etc.).
- **Dashed Line**: Horizontal line at ξ = 0 across all panels.
- **Annotations**:
- Panel (b): "ε_initial = -0.05π" (blue arrow pointing to orange line).
- Panel (a): "K_s=0" (red text).
- Panel (b): "K_s=2" (red text).
- Panel (c): "K_s=5" (red text).
### Detailed Analysis
#### Panel (a): K_s=0
- **Lines**: 10+ colored lines (red, blue, green, purple, etc.) curve upward, approaching ξ=0 asymptotically.
- **Trends**: All lines increase monotonically but never cross ξ=0.
- **Key Data**:
- Red line (bottom): Starts at ξ ≈ -0.5, reaches ξ ≈ -0.1 by t=6.
- Blue line: Starts at ξ ≈ -0.4, reaches ξ ≈ -0.05 by t=6.
- Green line: Starts at ξ ≈ -0.3, reaches ξ ≈ 0 by t=6.
#### Panel (b): K_s=2
- **Lines**: 10+ colored lines start at ε_initial = -0.05π (≈ -0.157) and rise toward ξ=0.
- **Trends**: Lines flatten faster than in (a), with sharper initial slopes.
- **Key Data**:
- Orange line (highlighted): Starts at ξ ≈ -0.157, reaches ξ ≈ -0.02 by t=2, then plateaus.
- Blue line: Starts at ξ ≈ -0.157, reaches ξ ≈ 0 by t=4.
- Green line: Starts at ξ ≈ -0.157, overshoots ξ=0 slightly before stabilizing.
#### Panel (c): K_s=5
- **Lines**: 10+ colored lines remain nearly flat near ξ=0.
- **Trends**: Minimal deviation from ξ=0 across all time.
- **Key Data**:
- All lines cluster tightly around ξ=0 (within ±0.01).
- No significant movement observed.
### Key Observations
1. **Convergence Behavior**:
- Higher K_s values (5 > 2 > 0) result in faster convergence to ξ=0.
- At K_s=5, the system stabilizes immediately; at K_s=0, convergence is slowest.
2. **Initial Condition Impact**:
- Panel (b) shows a deliberate perturbation (ε_initial = -0.05π), causing transient oscillations before stabilization.
3. **Color Consistency**:
- Legend colors match line colors across panels (e.g., red = K_s=0 in all panels).
### Interpretation
The graphs model a damped system approaching equilibrium (ξ=0) with stiffness-dependent dynamics:
- **K_s=0**: No damping; system evolves slowly toward equilibrium.
- **K_s=2**: Moderate damping; initial perturbations decay with oscillations.
- **K_s=5**: Overdamped; system stabilizes instantly without overshoot.
The ε_initial perturbation in (b) demonstrates how initial displacements are mitigated by increasing K_s. The dashed ξ=0 line serves as a universal reference for equilibrium across all conditions.