## Line Chart: GSM8K CoT Performance vs. Tokens Trained
### Overview
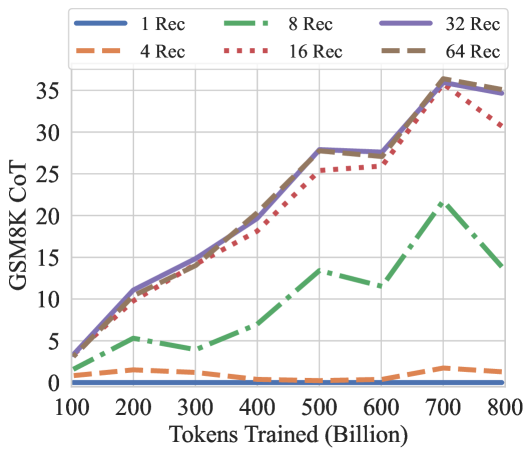
The image is a line chart comparing the performance of different models on the GSM8K CoT (Chain-of-Thought) task, based on the number of tokens they were trained on. The x-axis represents the number of tokens trained (in billions), and the y-axis represents the GSM8K CoT score. Different lines represent different configurations, likely related to the number of "Rec" (likely referring to "retrieval" or "recurrent") units or layers.
### Components/Axes
* **Title:** GSM8K CoT
* **X-axis:** Tokens Trained (Billion). Scale ranges from 100 to 800 in increments of 100.
* **Y-axis:** GSM8K CoT. Scale ranges from 0 to 35 in increments of 5.
* **Legend:** Located at the top of the chart.
* Blue line: 1 Rec
* Orange dashed line: 4 Rec
* Green dash-dot line: 8 Rec
* Red dotted line: 16 Rec
* Purple solid line: 32 Rec
* Brown dashed line: 64 Rec
### Detailed Analysis
* **1 Rec (Blue Line):** Remains relatively flat at a low score (approximately 0-1) across all training token values.
* **4 Rec (Orange Dashed Line):** Also remains relatively flat at a low score (approximately 1-2) across all training token values.
* **8 Rec (Green Dash-Dot Line):** Starts at approximately 2 at 100 tokens, increases to approximately 5 at 200 tokens, decreases to approximately 4 at 300 tokens, decreases again to approximately 3 at 400 tokens, increases to approximately 8 at 500 tokens, decreases to approximately 7 at 600 tokens, peaks at approximately 22 at 700 tokens, and decreases to approximately 15 at 800 tokens.
* **16 Rec (Red Dotted Line):** Starts at approximately 2 at 100 tokens, increases to approximately 11 at 200 tokens, increases to approximately 14 at 300 tokens, increases to approximately 20 at 400 tokens, increases to approximately 26 at 500 tokens, increases to approximately 27 at 600 tokens, peaks at approximately 36 at 700 tokens, and decreases to approximately 32 at 800 tokens.
* **32 Rec (Purple Solid Line):** Starts at approximately 2 at 100 tokens, increases to approximately 12 at 200 tokens, increases to approximately 15 at 300 tokens, increases to approximately 21 at 400 tokens, increases to approximately 28 at 500 tokens, increases to approximately 28 at 600 tokens, peaks at approximately 36 at 700 tokens, and decreases to approximately 35 at 800 tokens.
* **64 Rec (Brown Dashed Line):** Starts at approximately 2 at 100 tokens, increases to approximately 11 at 200 tokens, increases to approximately 14 at 300 tokens, increases to approximately 20 at 400 tokens, increases to approximately 28 at 500 tokens, increases to approximately 27 at 600 tokens, peaks at approximately 35 at 700 tokens, and decreases to approximately 34 at 800 tokens.
### Key Observations
* The "1 Rec" and "4 Rec" configurations show minimal improvement in GSM8K CoT score as the number of training tokens increases.
* The "8 Rec" configuration shows some improvement, but is significantly lower than the other configurations.
* The "16 Rec", "32 Rec", and "64 Rec" configurations show a significant increase in GSM8K CoT score as the number of training tokens increases, peaking around 700 billion tokens, and then slightly decreasing.
* The "16 Rec", "32 Rec", and "64 Rec" configurations perform similarly, with "32 Rec" and "64 Rec" performing slightly better than "16 Rec".
### Interpretation
The data suggests that increasing the number of training tokens significantly improves the performance of models on the GSM8K CoT task, but only when the model has a sufficient number of "Rec" units or layers (16, 32, or 64 in this case). Models with fewer "Rec" units (1, 4, or 8) do not benefit as much from increased training data. The performance of models with 16, 32, and 64 "Rec" units is similar, suggesting that there may be a point of diminishing returns in increasing the number of "Rec" units. The slight decrease in performance after 700 billion tokens for the "16 Rec", "32 Rec", and "64 Rec" configurations could indicate overfitting or a need for further optimization.