## Line Chart: GSM8K CoT Performance vs. Tokens Trained
### Overview
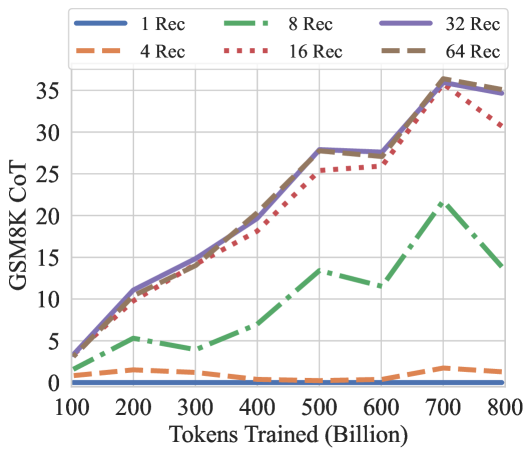
This line chart depicts the performance of a model on the GSM8K CoT (Chain of Thought) benchmark as a function of the number of tokens trained. The chart compares performance across different numbers of "Rec" (likely referring to retrieval or recursion steps). The x-axis represents the number of tokens trained in billions, and the y-axis represents the GSM8K CoT score.
### Components/Axes
* **X-axis:** "Tokens Trained (Billion)" - Scale ranges from approximately 100 to 800 billion tokens.
* **Y-axis:** "GSM8K CoT" - Scale ranges from 0 to 35.
* **Legend:** Located at the top-right of the chart. Contains the following lines and their corresponding colors:
* "1 Rec" - Blue solid line
* "4 Rec" - Orange dashed line
* "8 Rec" - Green dashed-dotted line
* "16 Rec" - Red dotted line
* "32 Rec" - Purple solid line
* "64 Rec" - Gray dashed line
### Detailed Analysis
The chart displays six lines, each representing a different number of "Rec" steps.
* **1 Rec (Blue):** Starts at approximately 1 at 100 billion tokens, rises steadily to around 8 at 400 billion tokens, then plateaus around 8-9 until 700 billion tokens, and then slightly increases to around 9 at 800 billion tokens.
* **4 Rec (Orange):** Starts at approximately 0 at 100 billion tokens, rises to around 3 at 400 billion tokens, then plateaus around 3-4 until 700 billion tokens, and then increases to around 4 at 800 billion tokens.
* **8 Rec (Green):** Starts at approximately 0 at 100 billion tokens, rises sharply to around 12 at 500 billion tokens, then decreases to around 21 at 700 billion tokens, and then drops to around 15 at 800 billion tokens.
* **16 Rec (Red):** Starts at approximately 2 at 100 billion tokens, rises steadily to around 20 at 400 billion tokens, then rises to around 33 at 700 billion tokens, and then decreases to around 32 at 800 billion tokens.
* **32 Rec (Purple):** Starts at approximately 4 at 100 billion tokens, rises steadily to around 27 at 500 billion tokens, plateaus around 27-29 until 700 billion tokens, and then decreases to around 28 at 800 billion tokens.
* **64 Rec (Gray):** Starts at approximately 1 at 100 billion tokens, rises steadily to around 26 at 500 billion tokens, plateaus around 26-28 until 700 billion tokens, and then decreases to around 26 at 800 billion tokens.
### Key Observations
* The performance generally increases with the number of tokens trained for all "Rec" values.
* The "16 Rec" line consistently shows the highest performance, peaking at approximately 33 at 700 billion tokens.
* The "8 Rec" line exhibits a notable peak around 500 billion tokens, followed by a decline. This is an outlier compared to the other lines.
* The "64 Rec" line shows a similar trend to the "32 Rec" line, but with slightly lower values.
* The "1 Rec" and "4 Rec" lines show the lowest performance, with "1 Rec" consistently performing slightly better than "4 Rec".
### Interpretation
The data suggests that increasing the number of tokens trained generally improves performance on the GSM8K CoT benchmark. The number of "Rec" steps appears to be a crucial parameter, with 16 steps yielding the best results. The outlier behavior of the "8 Rec" line could indicate a potential issue with that specific configuration, such as overfitting or instability. The plateauing of performance for higher "Rec" values (32 and 64) after a certain number of tokens trained suggests diminishing returns. The chart demonstrates the importance of both model scale (tokens trained) and architectural choices (number of "Rec" steps) in achieving high performance on this benchmark. The diminishing returns observed at higher "Rec" values suggest that there may be an optimal balance between these two factors.