## Line Graph: GSM8K Chain-of-Thought Performance vs. Tokens Trained
### Overview
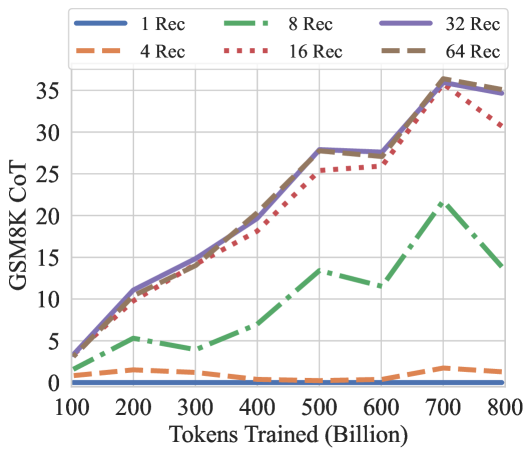
The image depicts a line graph comparing the performance of different "Rec" configurations (likely model variants or training setups) on the GSM8K Chain-of-Thought (CoT) benchmark. Performance is measured on the y-axis (0–35) against tokens trained (x-axis: 100B–800B). Six data series are represented by distinct line styles and colors.
### Components/Axes
- **X-axis**: "Tokens Trained (Billion)" with markers at 100, 200, 300, 400, 500, 600, 700, 800.
- **Y-axis**: "GSM8K CoT" with increments of 5 (0–35).
- **Legend**: Located in the top-left corner, mapping:
- **Blue solid**: 1 Rec
- **Orange dashed**: 4 Rec
- **Green dash-dot**: 8 Rec
- **Red dotted**: 16 Rec
- **Purple solid**: 32 Rec
- **Brown dashed**: 64 Rec
### Detailed Analysis
1. **1 Rec (Blue Solid Line)**:
- Starts near 0 at 100B tokens.
- Gradually increases to ~5 by 200B, ~10 by 300B, and plateaus near 10 by 800B.
- **Trend**: Slow, linear growth with minimal improvement after 300B.
2. **4 Rec (Orange Dashed Line)**:
- Begins at ~1 at 100B.
- Rises to ~2 by 200B, ~4 by 300B, and ~10 by 800B.
- **Trend**: Steeper than 1 Rec but plateaus similarly.
3. **8 Rec (Green Dash-Dot Line)**:
- Starts at ~2 at 100B.
- Peaks at ~14 by 500B, drops to ~12 by 600B, then rises to ~22 by 700B before falling to ~14 at 800B.
- **Trend**: Non-linear with a sharp mid-range peak and late-stage decline.
4. **16 Rec (Red Dotted Line)**:
- Begins at ~3 at 100B.
- Increases to ~15 by 500B, ~26 by 600B, ~35 by 700B, then drops to ~31 at 800B.
- **Trend**: Strong upward trajectory with a late-stage dip.
5. **32 Rec (Purple Solid Line)**:
- Starts at ~4 at 100B.
- Rises to ~28 by 600B, ~36 by 700B, then declines to ~35 at 800B.
- **Trend**: Sustained growth with a minor end-stage reduction.
6. **64 Rec (Brown Dashed Line)**:
- Begins at ~5 at 100B.
- Peaks at ~36 by 700B, then drops to ~34 at 800B.
- **Trend**: Highest performance overall, with a slight decline at maximum tokens.
### Key Observations
- **Performance Correlation**: Higher "Rec" values generally correlate with better performance, though diminishing returns are evident (e.g., 32 Rec vs. 64 Rec).
- **Anomalies**: The 8 Rec line shows an unexpected mid-range peak (~14 at 500B) followed by a drop, suggesting potential overfitting or instability.
- **Divergence**: At 800B tokens, 64 Rec (34) outperforms 32 Rec (35) by a narrow margin, but both lag behind their 700B peaks.
### Interpretation
The data suggests that increasing "Rec" (likely model complexity or training data diversity) improves GSM8K CoT performance up to a point. The 64 Rec configuration achieves the highest scores but shows a slight decline at 800B tokens, possibly indicating over-parameterization or data saturation. The 8 Rec line’s mid-range peak and subsequent drop highlight risks of overfitting in smaller configurations. The plateauing trends for lower "Rec" values (1–4 Rec) imply limited scalability without architectural or data enhancements. These patterns underscore the trade-off between model size and efficiency in CoT reasoning tasks.