TECHNICAL ASSET FINGERPRINT
f2384c819ebe2d7b7f8fe96c
Click to view fullscreen
Press ESC or click to close
FOUND IN PAPERS
EXPERT: gemma-3-27b-it-free VERSION 1
RUNTIME: google-free/gemma-3-27b-it
INTEL_VERIFIED
\n
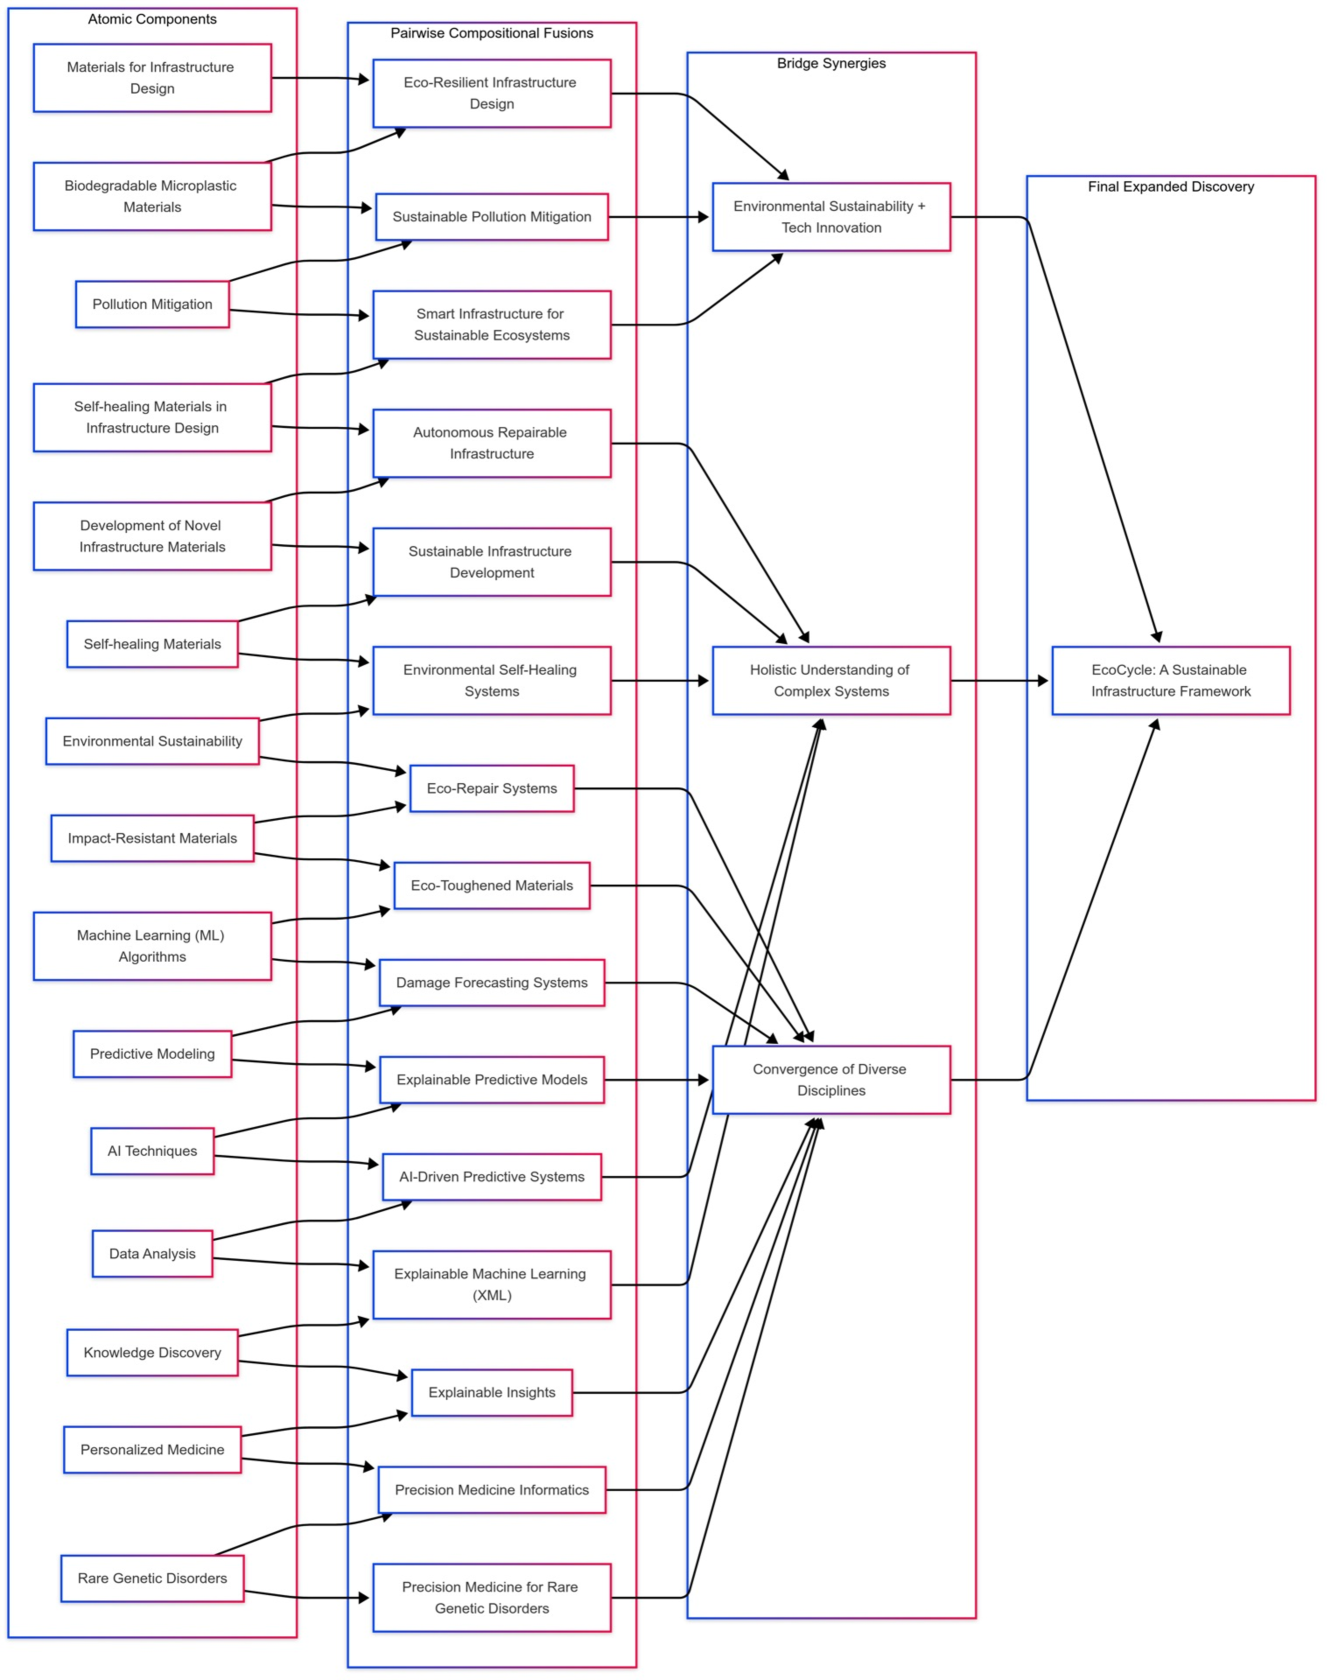
## Diagram: EcoCycle - A Sustainable Infrastructure Framework
### Overview
The image presents a complex, hierarchical diagram illustrating a framework called "EcoCycle: A Sustainable Infrastructure Framework". It depicts relationships between various concepts, ranging from atomic components to personalized medicine, through a series of interconnected boxes and arrows. The diagram is organized into several main branches, flowing generally from top to bottom. The diagram uses red and green boxes, with red arrows indicating flow and connections.
### Components/Axes
The diagram doesn't have traditional axes. Instead, it's structured around conceptual categories and sub-categories. The main branches are:
* **Top-Left Branch:** Starting with "Atomic Components" and leading to "Sustainable Pollution Mitigation".
* **Middle-Left Branch:** Starting with "Pollution Mitigation" and leading to "Sustainable Infrastructure Development".
* **Bottom-Left Branch:** Starting with "Environmental Sustainability" and leading to "Convergence of Diverse Disciplines".
* **Bottom-Right Branch:** Starting with "Machine Learning (ML) Algorithms" and leading to "Convergence of Diverse Disciplines".
* **Bottom-Right Branch:** Starting with "AI Techniques" and leading to "Convergence of Diverse Disciplines".
* **Bottom-Right Branch:** Starting with "Data Analysis" and leading to "Convergence of Diverse Disciplines".
* **Bottom-Right Branch:** Starting with "Knowledge Discovery" and leading to "Convergence of Diverse Disciplines".
* **Bottom-Right Branch:** Starting with "Personalized Medicine" and leading to "Convergence of Diverse Disciplines".
* **Bottom-Right Branch:** Starting with "Rare Genetic Disorders" and leading to "Convergence of Diverse Disciplines".
The diagram also includes intermediate boxes and a final box labeled "EcoCycle: A Sustainable Infrastructure Framework" positioned on the right side.
### Detailed Analysis / Content Details
Here's a breakdown of the diagram's content, following the flow from top to bottom:
1. **Atomic Components** connects to **Materials for Infrastructure Design**.
2. **Materials for Infrastructure Design** connects to **Pairwise Compositional Fusions**.
3. **Pairwise Compositional Fusions** connects to **Eco-Resilient Infrastructure Design**.
4. **Eco-Resilient Infrastructure Design** connects to **Bridge Synergies**.
5. **Bridge Synergies** connects to **Final Expanded Discovery**.
6. **Biodegradable Microplastic Materials** connects to **Sustainable Pollution Mitigation**.
7. **Sustainable Pollution Mitigation** connects to **Pollution Mitigation**.
8. **Pollution Mitigation** connects to **Self-healing Materials in Infrastructure Design**.
9. **Self-healing Materials in Infrastructure Design** connects to **Autonomous Repairable Infrastructure**.
10. **Autonomous Repairable Infrastructure** connects to **Sustainable Infrastructure Development**.
11. **Development of Novel Infrastructure Materials** connects to **Sustainable Infrastructure Development**.
12. **Sustainable Infrastructure Development** connects to **Self-healing Materials**.
13. **Sustainable Infrastructure Development** connects to **Environmental Self-Healing Systems**.
14. **Sustainable Infrastructure Development** connects to **Eco-Repair Systems**.
15. **Sustainable Infrastructure Development** connects to **Eco-Toughened Materials**.
16. **Sustainable Infrastructure Development** connects to **Damage Forecasting Systems**.
17. **Self-healing Materials** connects to **Environmental Sustainability**.
18. **Environmental Sustainability** connects to **Impact-Resistant Materials**.
19. **Impact-Resistant Materials** connects to **Machine Learning (ML) Algorithms**.
20. **Machine Learning (ML) Algorithms** connects to **Predictive Modeling**.
21. **Predictive Modeling** connects to **Explainable Predictive Models**.
22. **Explainable Predictive Models** connects to **AI-Driven Predictive Systems**.
23. **AI Techniques** connects to **AI-Driven Predictive Systems**.
24. **Data Analysis** connects to **Explainable Machine Learning (XML)**.
25. **Explainable Machine Learning (XML)** connects to **AI-Driven Predictive Systems**.
26. **Knowledge Discovery** connects to **Explainable Insights**.
27. **Explainable Insights** connects to **AI-Driven Predictive Systems**.
28. **Personalized Medicine** connects to **Precision Medicine Informatics**.
29. **Precision Medicine Informatics** connects to **AI-Driven Predictive Systems**.
30. **Rare Genetic Disorders** connects to **Precision Medicine for Rare Genetic Disorders**.
31. **Precision Medicine for Rare Genetic Disorders** connects to **AI-Driven Predictive Systems**.
32. **AI-Driven Predictive Systems** connects to **Convergence of Diverse Disciplines**.
33. **Convergence of Diverse Disciplines** connects to **Holistic Understanding of Complex Systems**.
34. **Holistic Understanding of Complex Systems** connects to **EcoCycle: A Sustainable Infrastructure Framework**.
### Key Observations
The diagram emphasizes the interconnectedness of various fields – from materials science and environmental engineering to machine learning and medicine – within the framework of sustainable infrastructure. The convergence of these disciplines is a central theme. The diagram is highly hierarchical, with concepts branching out and converging at key points. The use of red arrows suggests a flow of influence or dependency.
### Interpretation
The diagram illustrates a holistic approach to infrastructure development, aiming for sustainability through the integration of diverse scientific and technological advancements. The "EcoCycle" framework appears to be a conceptual model for achieving this integration. The emphasis on "Explainable AI" and "Predictive Modeling" suggests a focus on data-driven decision-making and proactive management of infrastructure systems. The inclusion of "Personalized Medicine" and "Rare Genetic Disorders" indicates a consideration of human health and well-being as integral components of sustainable infrastructure. The diagram suggests that advancements in atomic-level materials science can ultimately contribute to improvements in healthcare outcomes, demonstrating a far-reaching vision of interconnectedness. The diagram is not presenting data, but rather a proposed model or framework. It's a conceptual map of relationships rather than a quantitative analysis. The diagram's strength lies in its ability to visually represent the complexity of sustainable infrastructure and highlight the potential for synergistic innovation across multiple disciplines.
DECODING INTELLIGENCE...