## Graph Diagrams: Two Example Graphs
### Overview
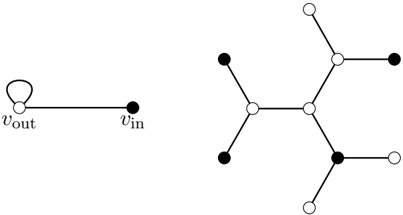
The image presents two separate graph diagrams. The first graph, on the left, consists of two nodes labeled "vout" and "vin", connected by a single edge. The "vout" node also has a self-loop. The second graph, on the right, is a more complex tree-like structure with alternating black and white nodes.
### Components/Axes
* **Nodes:** Represented by circles. Some are filled black, others are white.
* **Edges:** Represented by straight lines connecting the nodes.
* **Labels:** "vout" and "vin" are labels for specific nodes in the first graph.
### Detailed Analysis
**Left Graph:**
* Node "vout": A white (hollow) circle with a self-loop (an edge connecting the node to itself).
* Node "vin": A black (filled) circle.
* Edge: A single edge connects "vout" to "vin".
**Right Graph:**
* The graph has a central node (white) with three branches extending from it.
* Each branch consists of alternating white and black nodes.
* The nodes are connected by edges to form a tree-like structure.
* From the central node, the first branch goes to a black node, the second to a white node, and the third to a black node.
* The first branch (going to a black node) then connects to a white node, which connects to two black nodes.
* The second branch (going to a white node) connects to a black node, which connects to a white node, which connects to a black node.
* The third branch (going to a black node) connects to a white node, which connects to two white nodes.
### Key Observations
* The left graph is a simple directed graph with a self-loop.
* The right graph is a more complex, undirected tree-like graph with alternating node colors.
* The node colors (black and white) may represent different states or categories within the graph.
### Interpretation
The image presents two distinct graph structures. The left graph could represent a simple state transition or a basic network connection. The right graph, with its alternating node colors and tree-like structure, could represent a hierarchical relationship or a branching process where different levels or categories alternate. The specific meaning of the node colors and the graph structures would depend on the context in which these graphs are used.