## Diagram: Dual-System Architecture Representation
### Overview
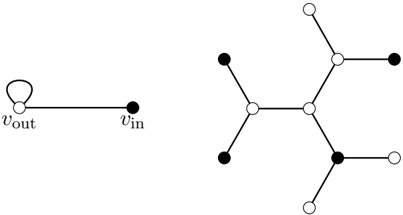
The image contains two distinct diagrams:
1. **Left Diagram**: A simple directed graph with two nodes (`v_out` and `v_in`) and a feedback loop.
2. **Right Diagram**: A complex undirected network with labeled and unlabeled nodes, forming a hierarchical structure.
### Components/Axes
#### Left Diagram
- **Nodes**:
- `v_out` (white node with a black loop)
- `v_in` (black node)
- **Edges**:
- A directed edge from `v_out` to `v_in`.
- A self-loop (feedback edge) on `v_out`.
- **Labels**:
- `v_out` and `v_in` explicitly labeled.
- **Legend**: None.
#### Right Diagram
- **Nodes**:
- **Black Nodes**: Labeled `v_in` (top-left) and `v_out` (bottom-right).
- **White Nodes**: Unlabeled, acting as intermediate connectors.
- **Edges**:
- Multiple undirected edges connecting nodes in a tree-like structure.
- Central node (white) connects to three branches:
- Left branch: `v_in` → white node → black node.
- Right branch: `v_out` → white node → black node.
- Bottom branch: Central node → white node → black node.
- **Layout**:
- Nodes arranged in a hierarchical, radial pattern.
- No explicit axis or scale.
### Detailed Analysis
#### Left Diagram
- The feedback loop on `v_out` suggests a self-referential process (e.g., a system that processes its own output).
- The directed edge from `v_out` to `v_in` implies a unidirectional data flow or dependency.
#### Right Diagram
- The black nodes (`v_in`, `v_out`) likely represent input/output endpoints, while white nodes act as intermediaries (e.g., processing units or routers).
- The central white node serves as a hub, distributing connections to peripheral nodes.
- The absence of arrows indicates bidirectional or undirected relationships (e.g., mutual dependencies).
### Key Observations
1. **Contrast in Complexity**:
- The left diagram is minimalistic, focusing on feedback and direct flow.
- The right diagram emphasizes distributed connectivity and hierarchical organization.
2. **Node Roles**:
- Black nodes (`v_in`, `v_out`) are consistently positioned at the periphery in both diagrams, suggesting they are endpoints.
3. **Edge Behavior**:
- Left diagram edges are directional; right diagram edges are undirected.
### Interpretation
- **Left Diagram**: Likely represents a simplified feedback control system or a basic data pipeline with self-regulation. The loop on `v_out` could indicate error correction or iterative processing.
- **Right Diagram**: Suggests a distributed network (e.g., communication, computational, or organizational structure). The central hub and peripheral nodes imply redundancy, load balancing, or fault tolerance.
- **Relationships**:
- The left diagram’s feedback loop might be a component of the larger system depicted in the right diagram.
- The right diagram’s undirected edges could model bidirectional communication or shared resources between nodes.
- **Anomalies**:
- The right diagram’s unlabeled white nodes lack explicit roles, leaving their function ambiguous.
- The absence of a legend or scale limits quantitative analysis.
This dual representation highlights the interplay between simplicity (feedback mechanisms) and complexity (distributed networks) in system design.