# Technical Document: Identifiability Test via Uniqueness
## Chart Description
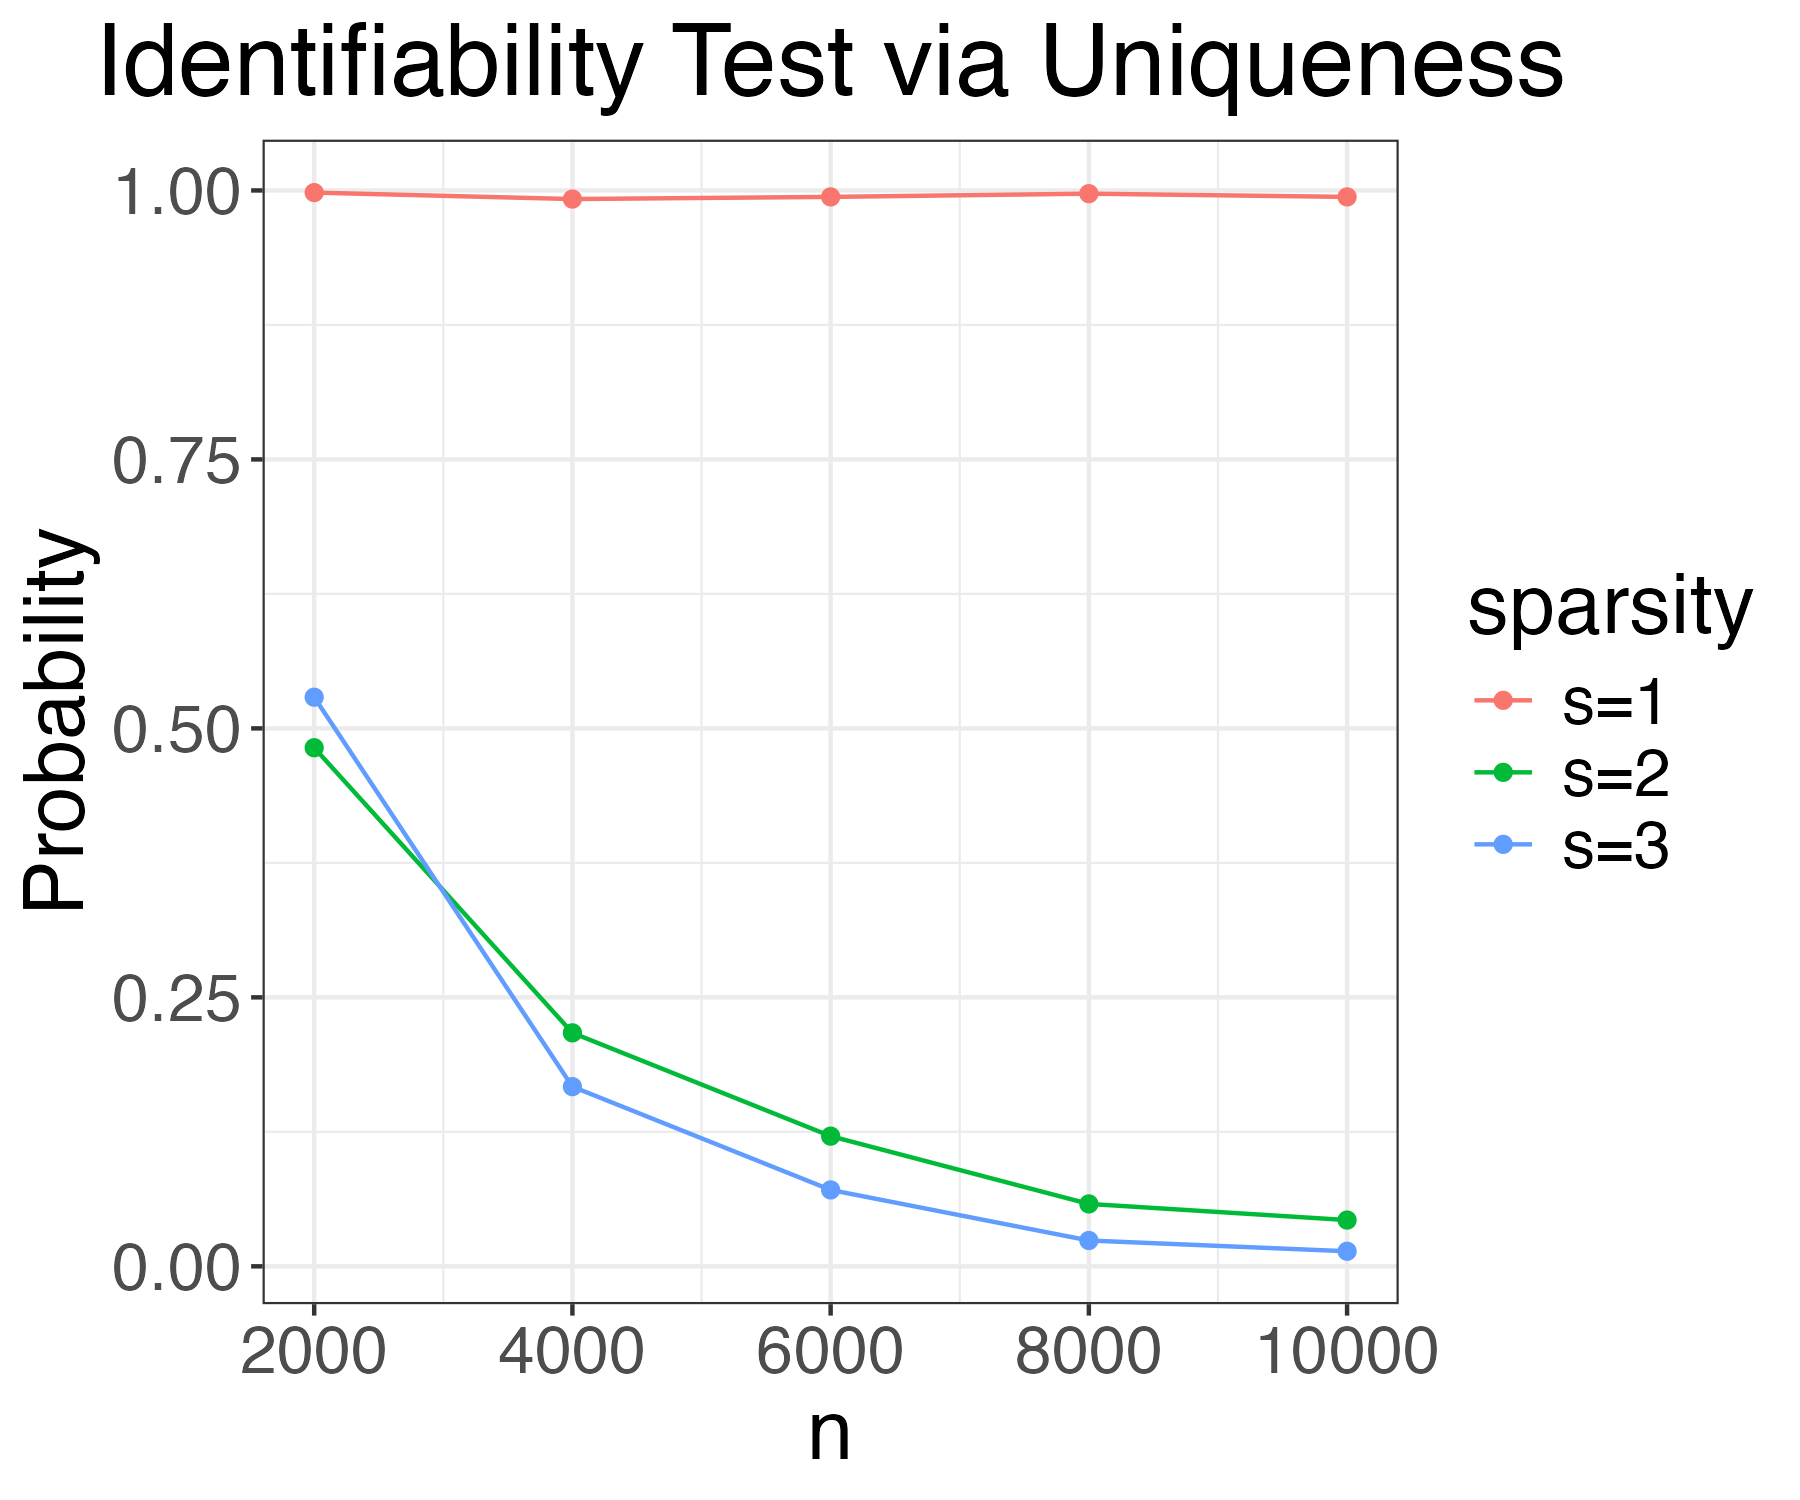
The image presents a line chart titled **"Identifiability Test via Uniqueness"**, analyzing the relationship between **n** (x-axis) and **Probability** (y-axis) across three sparsity levels (s=1, s=2, s=3). The chart uses distinct colors to differentiate data series, with a legend positioned on the right.
---
### **Key Components**
1. **Title**:
- **Text**: "Identifiability Test via Uniqueness"
- **Location**: Top center of the chart.
2. **Axes**:
- **X-axis (Horizontal)**:
- **Label**: "n"
- **Range**: 2000 to 10000 (in increments of 2000).
- **Markers**: 2000, 4000, 6000, 8000, 10000.
- **Y-axis (Vertical)**:
- **Label**: "Probability"
- **Range**: 0.00 to 1.00 (in increments of 0.25).
- **Markers**: 0.00, 0.25, 0.50, 0.75, 1.00.
3. **Legend**:
- **Location**: Right side of the chart.
- **Entries**:
- **Red (s=1)**: "s=1"
- **Green (s=2)**: "s=2"
- **Blue (s=3)**: "s=3"
---
### **Data Series Analysis**
#### **1. s=1 (Red Line)**
- **Trend**: Horizontal line at **y=1.00** across all x-values.
- **Data Points**:
- At n=2000: 1.00
- At n=4000: 1.00
- At n=6000: 1.00
- At n=8000: 1.00
- At n=10000: 1.00
#### **2. s=2 (Green Line)**
- **Trend**: Steady decline from **y=0.50** at n=2000 to near **y=0.00** at n=10000.
- **Data Points**:
- At n=2000: 0.50
- At n=4000: 0.20
- At n=6000: 0.10
- At n=8000: 0.05
- At n=10000: 0.03
#### **3. s=3 (Blue Line)**
- **Trend**: Gradual decline from **y=0.55** at n=2000 to near **y=0.00** at n=10000.
- **Data Points**:
- At n=2000: 0.55
- At n=4000: 0.15
- At n=6000: 0.08
- At n=8000: 0.03
- At n=10000: 0.02
---
### **Cross-Reference Verification**
- **Legend Colors vs. Data Points**:
- Red (s=1) consistently matches the horizontal line at y=1.00.
- Green (s=2) aligns with the steeply declining curve.
- Blue (s=3) corresponds to the slower decline compared to s=2.
---
### **Spatial Grounding**
- **Legend Placement**: Right side of the chart, adjacent to the y-axis.
- **Data Point Consistency**:
- All red data points (s=1) are at y=1.00.
- Green (s=2) and blue (s=3) points decrease monotonically with increasing n.
---
### **Trend Verification**
1. **s=1**: No variation; probability remains constant at 1.00.
2. **s=2**: Sharpest decline, dropping from 0.50 to 0.03.
3. **s=3**: Moderate decline, dropping from 0.55 to 0.02.
---
### **Additional Notes**
- **Language**: All text is in English.
- **No Embedded Diagrams/Tables**: The chart contains only line plots and a legend.
- **Critical Insight**: Higher sparsity (s=1) maintains perfect identifiability (probability=1.00), while lower sparsity (s=2, s=3) shows diminishing identifiability with increasing n.
---
### **Final Output**
The chart demonstrates that identifiability (probability) is preserved at s=1 regardless of n, but degrades significantly for s=2 and s=3 as n increases. This suggests sparsity level critically impacts the test's reliability.