\n
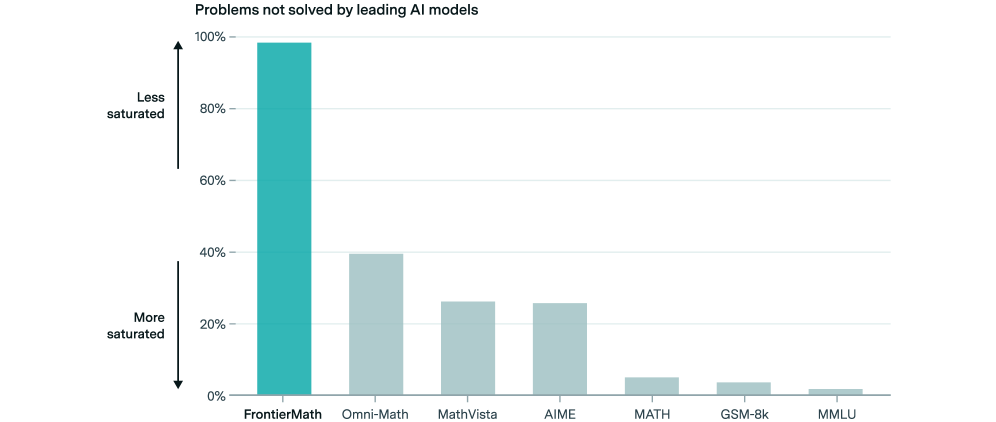
## Bar Chart: Problems Not Solved by Leading AI Models
### Overview
This is a vertical bar chart illustrating the percentage of problems not solved by leading AI models across various datasets. The x-axis represents different problem sets, and the y-axis represents the percentage of unsolved problems. The chart uses a teal color for the bars. An arrow on the left indicates "Less saturated" corresponds to higher percentages, and an arrow on the right indicates "More saturated" corresponds to lower percentages.
### Components/Axes
* **Title:** "Problems not solved by leading AI models" (positioned at the top-center)
* **X-axis:** Problem Sets: FrontierMath, Omni-Math, MathVista, AIME, MATH, GSM-8k, MMLU (positioned at the bottom)
* **Y-axis:** Percentage of Unsolved Problems (0% to 100%, positioned on the left)
* **Color Scheme:** Teal bars representing the percentage of unsolved problems.
* **Saturation Arrows:** "Less saturated" pointing upwards, "More saturated" pointing downwards.
### Detailed Analysis
The chart displays the following approximate data points:
* **FrontierMath:** Approximately 95% of problems are not solved. (Tallest bar)
* **Omni-Math:** Approximately 40% of problems are not solved.
* **MathVista:** Approximately 25% of problems are not solved.
* **AIME:** Approximately 20% of problems are not solved.
* **MATH:** Approximately 5% of problems are not solved. (Shortest bar)
* **GSM-8k:** Approximately 3% of problems are not solved.
* **MMLU:** Approximately 2% of problems are not solved.
The bars generally decrease in height from left to right, indicating a decreasing percentage of unsolved problems as you move across the datasets.
### Key Observations
* FrontierMath has the highest percentage of unsolved problems by a significant margin.
* MATH, GSM-8k, and MMLU have very low percentages of unsolved problems, indicating high performance on these datasets.
* There is a steep drop in unsolved problems between Omni-Math and MathVista.
* The difference between AIME and MATH is noticeable.
### Interpretation
The data suggests that leading AI models struggle significantly with the FrontierMath dataset, while performing relatively well on datasets like MATH, GSM-8k, and MMLU. This could indicate that FrontierMath presents a unique challenge, perhaps involving problem types or complexity levels not well-represented in the other datasets. The decreasing trend in unsolved problems across the datasets suggests that the AI models are becoming more capable of solving a wider range of mathematical problems. The large difference between FrontierMath and the other datasets could be due to the nature of the problems in FrontierMath, which may require reasoning skills or knowledge that the models currently lack. The chart highlights the limitations of current AI models in solving complex mathematical problems and suggests areas for future research and development. The use of "saturation" as a visual cue is interesting, implying that higher percentages represent a less "saturated" state of AI problem-solving ability, and vice versa.