## Bar Chart: Problems Not Solved by Leading AI Models
### Overview
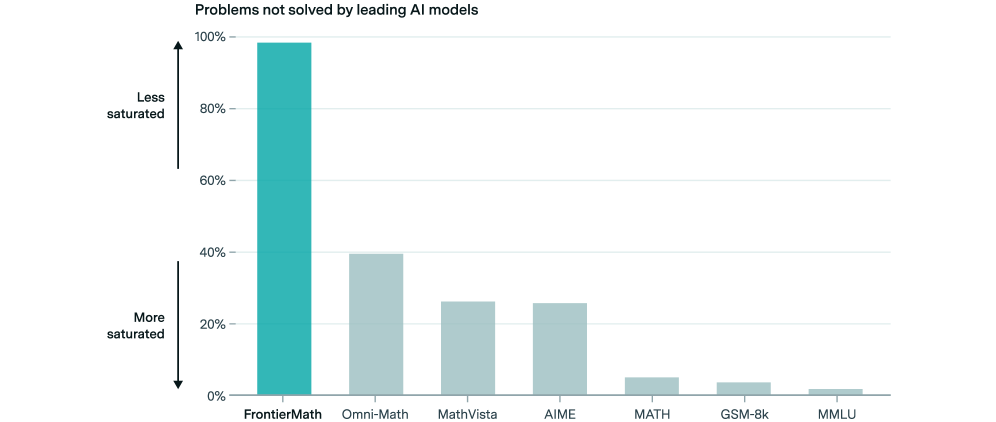
The image is a vertical bar chart titled "Problems not solved by leading AI models." It displays the percentage of problems that leading AI models fail to solve across seven different benchmark datasets or problem categories. The chart uses a single color (teal) for all bars, with the height representing the percentage of unsolved problems. The y-axis is labeled with an inverted concept of "saturation," where a higher percentage indicates a problem space that is "Less saturated" (i.e., more problems remain unsolved).
### Components/Axes
* **Chart Title:** "Problems not solved by leading AI models" (top center).
* **Y-Axis:**
* **Scale:** Linear scale from 0% to 100%, with major tick marks at 0%, 20%, 40%, 60%, 80%, and 100%.
* **Label:** A vertical arrow on the left side with text annotations. The top of the arrow (near 100%) is labeled "Less saturated." The bottom of the arrow (near 0%) is labeled "More saturated." This indicates that a higher bar (higher percentage) corresponds to a problem domain where AI models have lower coverage or success.
* **X-Axis:**
* **Categories (from left to right):** FrontierMath, Omni-Math, MathVista, AIME, MATH, GSM-8k, MMLU.
* These are labels for different AI evaluation benchmarks, primarily in mathematics and general knowledge.
* **Data Series:** A single series represented by teal-colored bars. There is no separate legend, as the x-axis labels directly identify each bar.
### Detailed Analysis
The chart presents the following approximate values for the percentage of problems not solved, from highest to lowest:
1. **FrontierMath:** The bar reaches approximately **98%**. This is the tallest bar by a significant margin.
2. **Omni-Math:** The bar reaches approximately **40%**.
3. **MathVista:** The bar reaches approximately **26%**.
4. **AIME:** The bar reaches approximately **25%**. It is very close in height to MathVista.
5. **MATH:** The bar reaches approximately **5%**.
6. **GSM-8k:** The bar reaches approximately **3%**.
7. **MMLU:** The bar reaches approximately **2%**. This is the shortest bar.
**Visual Trend:** The data series shows a steep descending trend from left to right. There is a very large drop from the first category (FrontierMath) to the second (Omni-Math), followed by a more gradual decline through the middle categories, and finally a cluster of very low values for the last three categories.
### Key Observations
* **Dominant Outlier:** FrontierMath is a massive outlier, with nearly all problems (~98%) reported as unsolved. This suggests it represents a frontier of difficulty far beyond the other benchmarks listed.
* **Clustering:** The benchmarks fall into three distinct clusters:
* **High Unsolved Rate:** FrontierMath (standalone).
* **Moderate Unsolved Rate:** Omni-Math, MathVista, AIME (ranging from ~25% to 40%).
* **Low Unsolved Rate:** MATH, GSM-8k, MMLU (all at or below 5%).
* **Saturation Interpretation:** The "More saturated" label at the 0% end implies that benchmarks like MMLU and GSM-8k are considered "saturated," meaning leading AI models have achieved very high performance (solving almost all problems), leaving few unsolved. Conversely, FrontierMath is "less saturated," indicating it is a largely unsolved challenge.
### Interpretation
This chart visualizes the current "frontier" of AI capabilities, specifically in reasoning and knowledge tasks. It suggests that while leading models have effectively mastered certain established benchmarks (like MMLU for general knowledge and GSM-8k for grade-school math), they face substantial challenges with more advanced or specialized problem sets.
The data implies a hierarchy of difficulty. **FrontierMath** likely represents cutting-edge, research-level mathematical problems that are beyond the reach of current public models. **Omni-Math, MathVista, and AIME** represent a middle tier of challenging competition-level or multimodal math problems where models still fail a significant portion of the time. The near-saturation of **MATH, GSM-8k, and MMLU** indicates these benchmarks may no longer be effective for distinguishing the capabilities of top-tier models, as performance is nearing the ceiling.
The key takeaway is the identification of a significant gap between model performance on established tests and their ability to solve the most advanced problems, highlighting a clear direction for future AI research and development. The stark visual contrast emphasizes how far the field is from solving the hardest class of problems represented here.