## Bar Chart: Problems not solved by leading AI models
### Overview
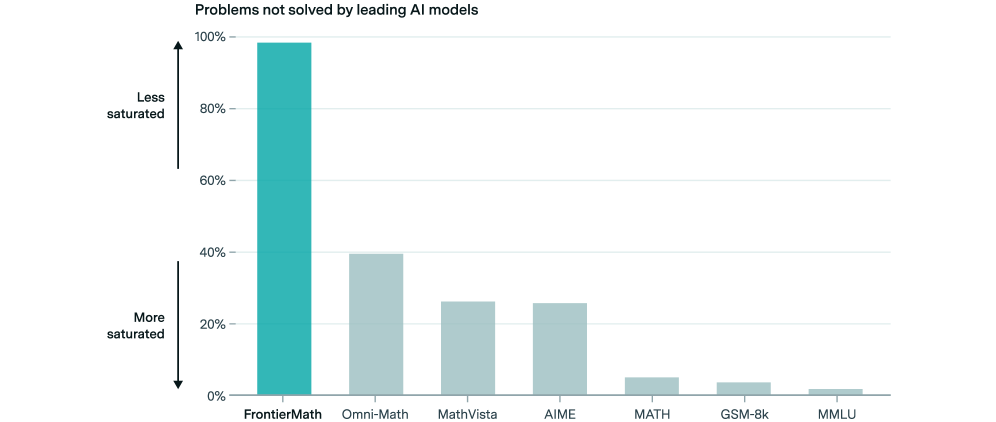
The chart visualizes the percentage of mathematical problems not solved by various AI models, with a color-coded saturation gradient indicating performance levels. FrontierMath shows the highest failure rate (100%), while MMLU demonstrates the lowest (1%).
### Components/Axes
- **Title**: "Problems not solved by leading AI models"
- **Y-axis**:
- Label: "Problems not solved by leading AI models"
- Scale: 0% (bottom) to 100% (top)
- Saturation gradient:
- Top: "Less saturated" (blue)
- Bottom: "More saturated" (gray)
- **X-axis**:
- Categories: FrontierMath, Omni-Math, MathVista, AIME, MATH, GSM-8k, MMLU
- **Legend**:
- Blue: "Less saturated"
- Gray: "More saturated"
### Detailed Analysis
1. **FrontierMath**:
- Bar height: 100% (blue)
- Position: Far left
- Color matches "Less saturated" legend
2. **Omni-Math**:
- Bar height: ~40% (gray)
- Position: Second from left
3. **MathVista**:
- Bar height: ~25% (gray)
- Position: Third from left
4. **AIME**:
- Bar height: ~25% (gray)
- Position: Fourth from left
5. **MATH**:
- Bar height: ~5% (gray)
- Position: Fifth from left
6. **GSM-8k**:
- Bar height: ~3% (gray)
- Position: Sixth from left
7. **MMLU**:
- Bar height: ~1% (gray)
- Position: Far right
### Key Observations
- **Performance Gradient**: Models progress from worst (FrontierMath) to best (MMLU) left to right
- **Saturation Inversion**: Higher saturation (gray) correlates with better performance (lower unsolved percentages)
- **Outlier**: FrontierMath's 100% failure rate stands out as an extreme case
- **Color Consistency**: All gray bars align with "More saturated" legend, blue bar with "Less saturated"
### Interpretation
The data reveals a stark performance hierarchy among AI models for mathematical problem-solving:
1. **FrontierMath's Failure**: Its 100% unsolved rate suggests fundamental limitations in current AI architectures for complex mathematics
2. **Saturation Paradox**: The inverse relationship between saturation and performance (gray = better) implies the visualization uses color to encode success rather than problem difficulty
3. **Progressive Improvement**: Newer models (MMLU, GSM-8k) show exponential improvement over older ones (MathVista, AIME), with MMLU achieving near-perfect performance
4. **Practical Implications**: The chart highlights the need for architectural innovations in AI systems to handle advanced mathematical reasoning, while also demonstrating the potential of newer models like MMLU in closing this gap
The visualization effectively communicates both quantitative performance differences and qualitative aspects (saturation) through strategic color coding, though the inverted saturation logic may require additional context for full interpretation.