## Heatmap: Language Model Performance Comparison
### Overview
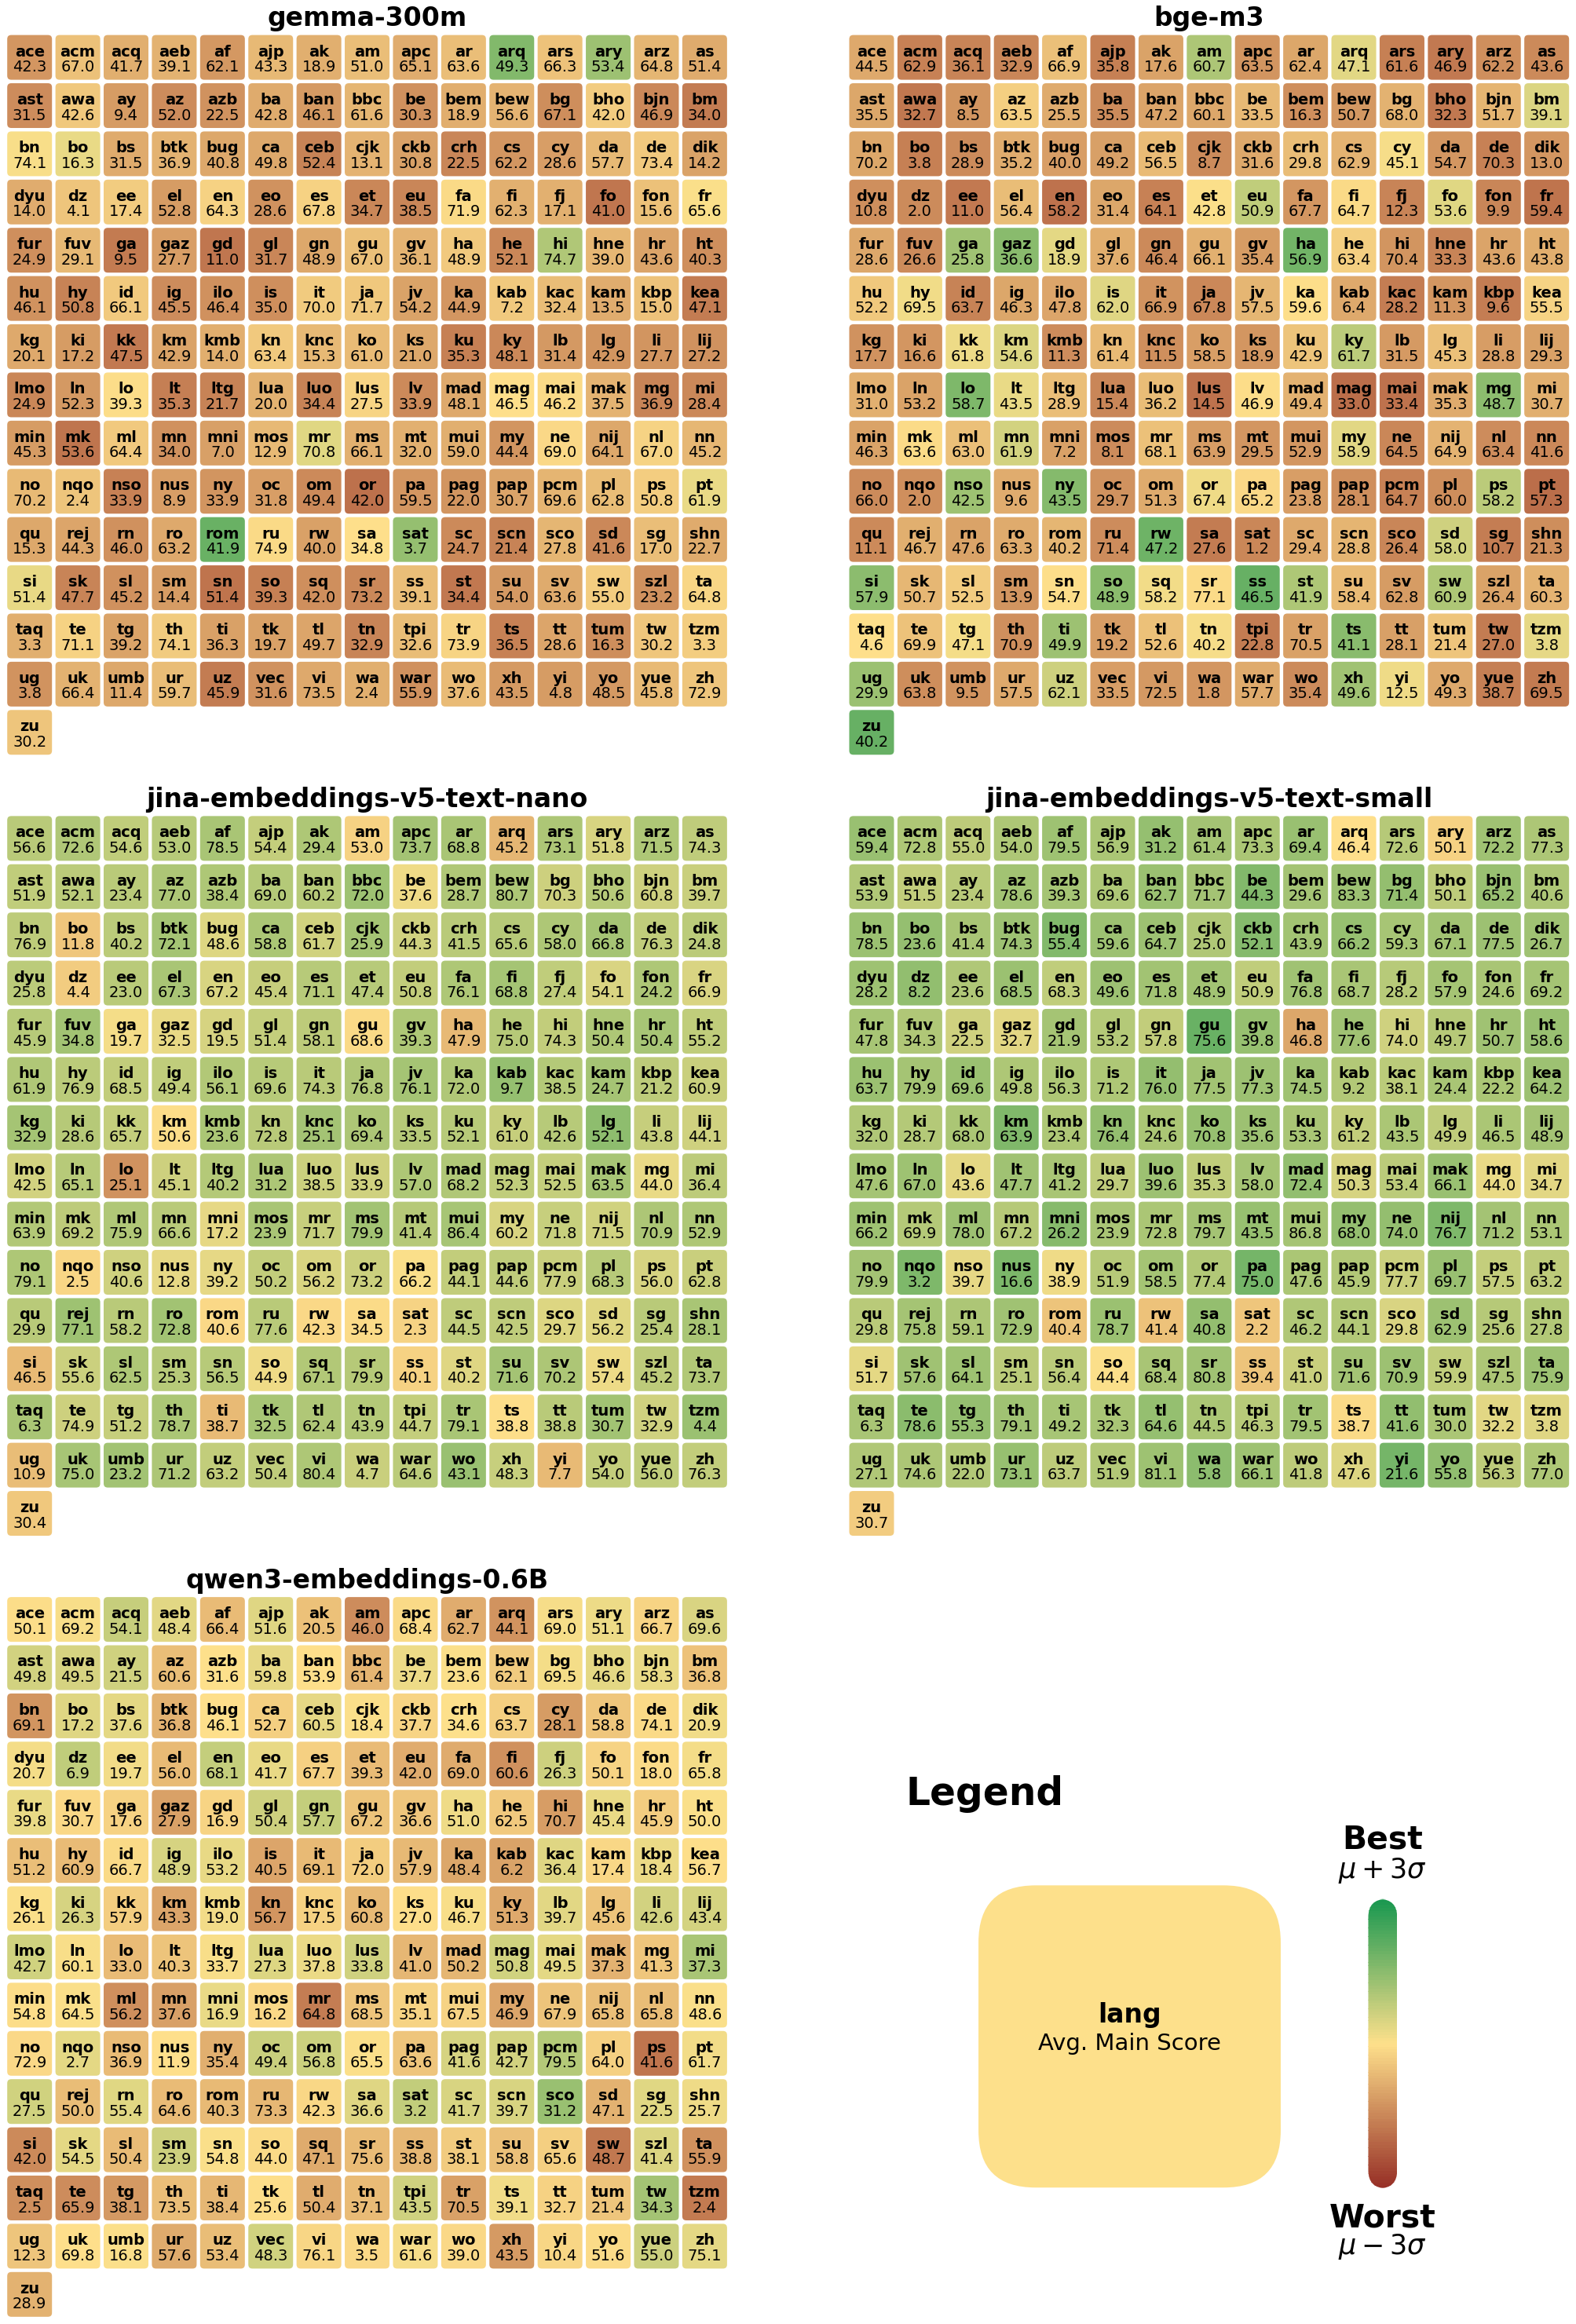
The image presents a series of heatmaps comparing the performance of different language models (gamma-300m, bge-m3, jina-embeddings-v5-text-nano, jina-embeddings-v5-text-small, and qwen3-embeddings-0.6B) across a range of languages. Each heatmap cell represents a language, with the color indicating the average main score. The legend indicates that green represents the best performance (μ + 3σ) and red represents the worst performance (μ - 3σ).
### Components/Axes
* **Titles:**
* gamma-300m
* bge-m3
* jina-embeddings-v5-text-nano
* jina-embeddings-v5-text-small
* qwen3-embeddings-0.6B
* **Heatmap Cells:** Each cell contains two lines of text. The top line is a two- or three-letter language code (e.g., "ace", "acm", "acq"), and the bottom line is a numerical score.
* **Legend:** Located in the bottom right corner.
* Title: "Legend"
* Label: "lang"
* Description: "Avg. Main Score"
* Color Scale: Ranges from green (Best, μ + 3σ) to red (Worst, μ - 3σ).
### Detailed Analysis
#### gamma-300m
* The heatmap is a 16x10 grid of language codes and scores.
* The top-left cell contains "ace" and "42.3". The color is a light orange.
* The bottom-right cell contains "zu" and "30.2". The color is a dark orange/red.
* The scores range approximately from 3.3 to 77.9.
#### bge-m3
* The heatmap is a 16x10 grid of language codes and scores.
* The top-left cell contains "ace" and "44.5". The color is a light orange.
* The bottom-right cell contains "zu" and "40.2". The color is a dark orange/red.
* The scores range approximately from 1.2 to 79.5.
#### jina-embeddings-v5-text-nano
* The heatmap is a 16x10 grid of language codes and scores.
* The top-left cell contains "ace" and "56.6". The color is a light yellow.
* The bottom-right cell contains "zu" and "30.4". The color is a dark orange/red.
* The scores range approximately from 2.3 to 80.7.
#### jina-embeddings-v5-text-small
* The heatmap is a 16x10 grid of language codes and scores.
* The top-left cell contains "ace" and "59.4". The color is a light yellow.
* The bottom-right cell contains "zu" and "30.7". The color is a dark orange/red.
* The scores range approximately from 2.3 to 86.8.
#### qwen3-embeddings-0.6B
* The heatmap is a 16x10 grid of language codes and scores.
* The top-left cell contains "ace" and "50.1". The color is a light orange.
* The bottom-right cell contains "zu" and "28.9". The color is a dark orange/red.
* The scores range approximately from 3.2 to 81.1.
### Key Observations
* The language codes appear to be consistent across all heatmaps.
* The color distribution varies between the models, indicating different performance levels for each language.
* The "zu" language consistently has a low score across all models, indicated by the dark orange/red color.
* The jina-embeddings-v5-text-small model appears to have the highest scores overall, with more cells colored yellow and green.
### Interpretation
The heatmaps provide a visual comparison of the performance of different language models across a diverse set of languages. The color-coded scores allow for a quick assessment of each model's strengths and weaknesses. The consistent language codes enable a direct comparison of performance for each language across the models. The jina-embeddings-v5-text-small model seems to perform better overall, while some languages like "zu" consistently score lower across all models, suggesting potential challenges in processing or understanding these languages. The data suggests that model selection should be tailored to the specific language requirements of the application.