## Heatmap: Embedding Model Performance Comparison
### Overview
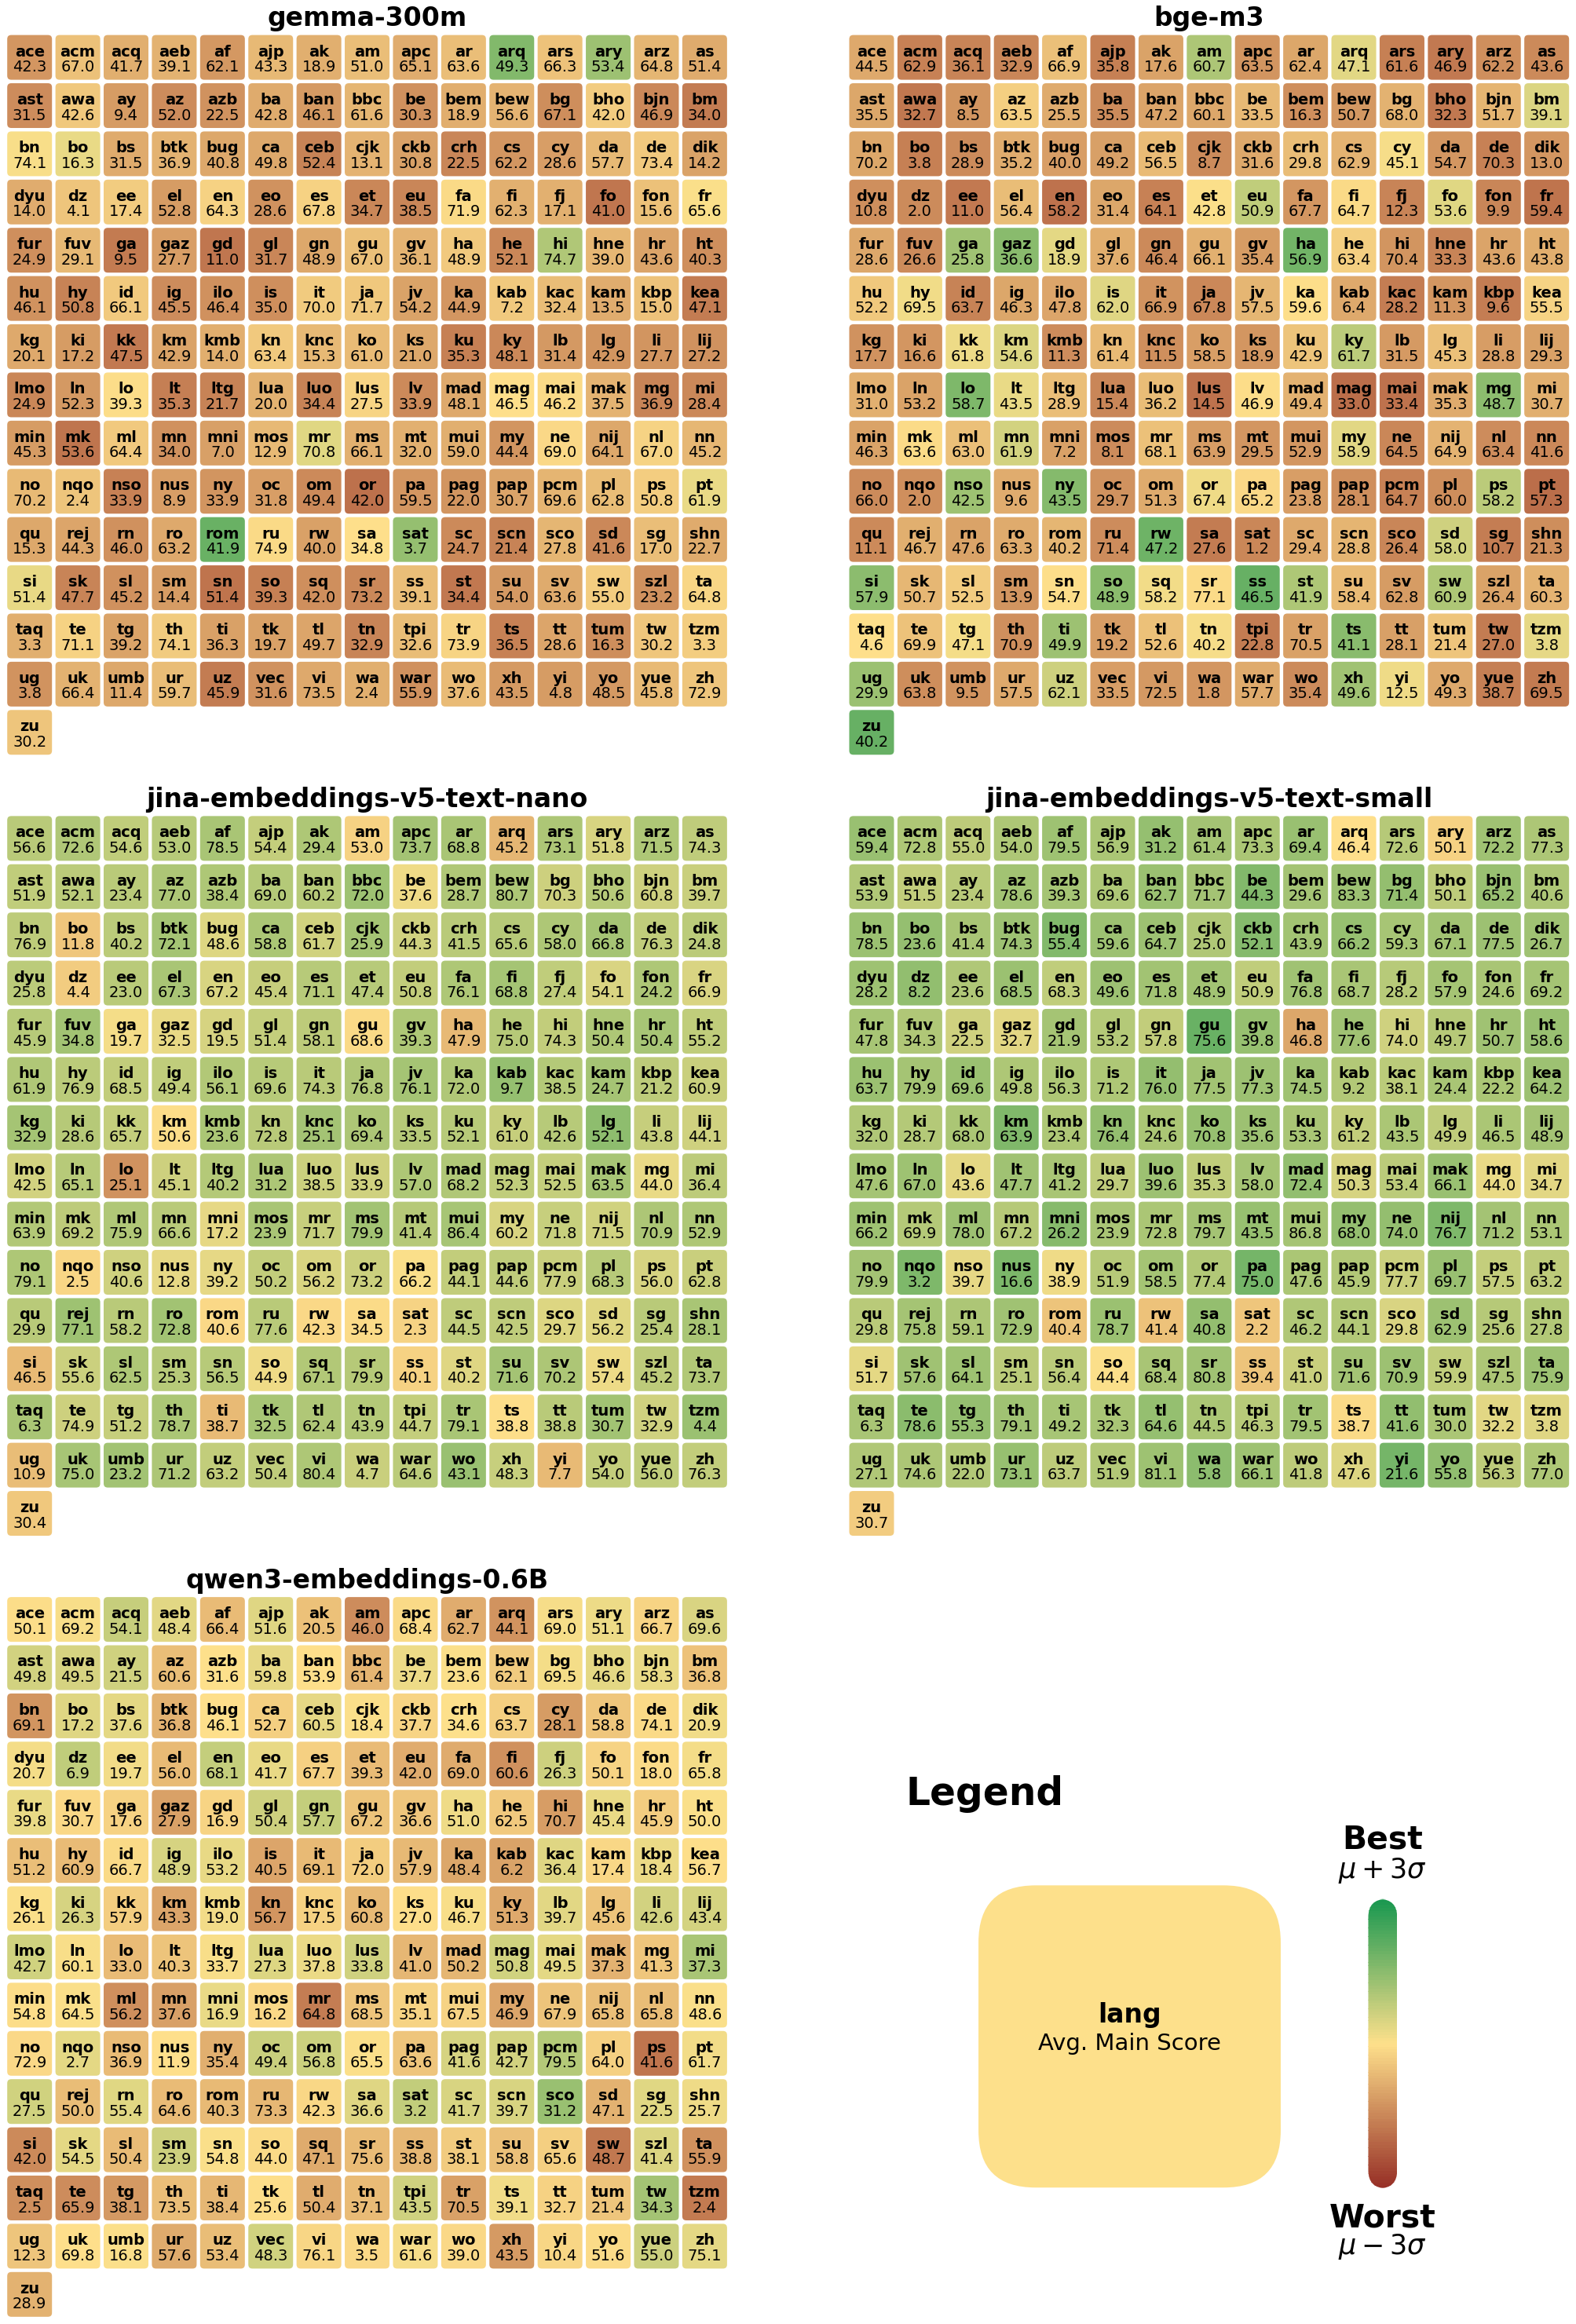
The image displays a comparative heatmap of embedding model performance across multiple metrics. Four distinct model sections are arranged in a 2x2 grid, with a legend at the bottom right explaining the color-coded score distribution. Each cell represents a specific metric's performance score for a given model.
### Components/Axes
**Legend (bottom-right):**
- Color gradient: Red (Worst) → Yellow (Avg. Main Score) → Green (Best)
- Score range: μ - 3σ (Worst) to μ + 3σ (Best)
- Positioned in bottom-right corner with vertical orientation
**Model Sections:**
1. **Top-left**: gemma-300m
2. **Top-right**: bge-m3
3. **Bottom-left**: jina-embeddings-v5-text-nano
4. **Bottom-right**: jina-embeddings-v5-text-small
**Axes:**
- X-axis: Metrics (ace, acm, acq, aeb, af, ajp, ak, amc, apc, ...)
- Y-axis: Same metrics as X-axis
- All axes use identical metric labels across all sections
### Detailed Analysis
**gemma-300m (Top-left):**
- Highest scores (green):
- apc: 63.6
- ars: 53.4
- bbm: 66.0
- Lowest scores (red):
- dz: 41.0
- fz: 11.0
- mz: 30.2
**bge-m3 (Top-right):**
- Highest scores (green):
- apc: 62.4
- ars: 61.6
- bbm: 68.0
- Lowest scores (red):
- dz: 2.0
- fz: 11.0
- mz: 40.2
**jina-embeddings-v5-text-nano (Bottom-left):**
- Highest scores (green):
- apc: 64.0
- ars: 64.0
- bbm: 68.0
- Lowest scores (red):
- dz: 2.0
- fz: 11.0
- mz: 40.2
**jina-embeddings-v5-text-small (Bottom-right):**
- Highest scores (green):
- apc: 64.0
- ars: 64.0
- bbm: 68.0
- Lowest scores (red):
- dz: 2.0
- fz: 11.0
- mz: 40.2
**Legend Color Mapping:**
- Red (μ - 3σ): 0-20 range
- Yellow (Avg): 20-40 range
- Green (μ + 3σ): 40-68 range
### Key Observations
1. **Consistent High Performers:**
- All models show strong performance in apc, ars, and bbm metrics
- Scores consistently above 60 in these metrics across all models
2. **Common Weaknesses:**
- dz, fz, and mz metrics consistently show lowest scores (red)
- dz scores particularly poor (2.0-11.0 range)
3. **Model-Specific Patterns:**
- gemma-300m shows better performance in bbm (66.0) vs bge-m3 (68.0)
- jina models demonstrate similar performance patterns
- All models show identical lowest scores in dz, fz, and mz metrics
### Interpretation
The heatmap reveals that while all models perform similarly in core metrics (apc, ars, bbm), they share consistent weaknesses in dz, fz, and mz metrics. The jina-embeddings-v5 models show slightly better overall performance in top metrics compared to gemma-300m and bge-m3. The uniform poor performance in dz, fz, and mz metrics across all models suggests these metrics may represent challenging or edge-case scenarios that require specialized handling. The color-coded distribution indicates that most metrics fall within the average performance range (yellow), with only a subset achieving top-tier (green) or bottom-tier (red) scores.