## Line Chart: Success Rate vs. Temperature
### Overview
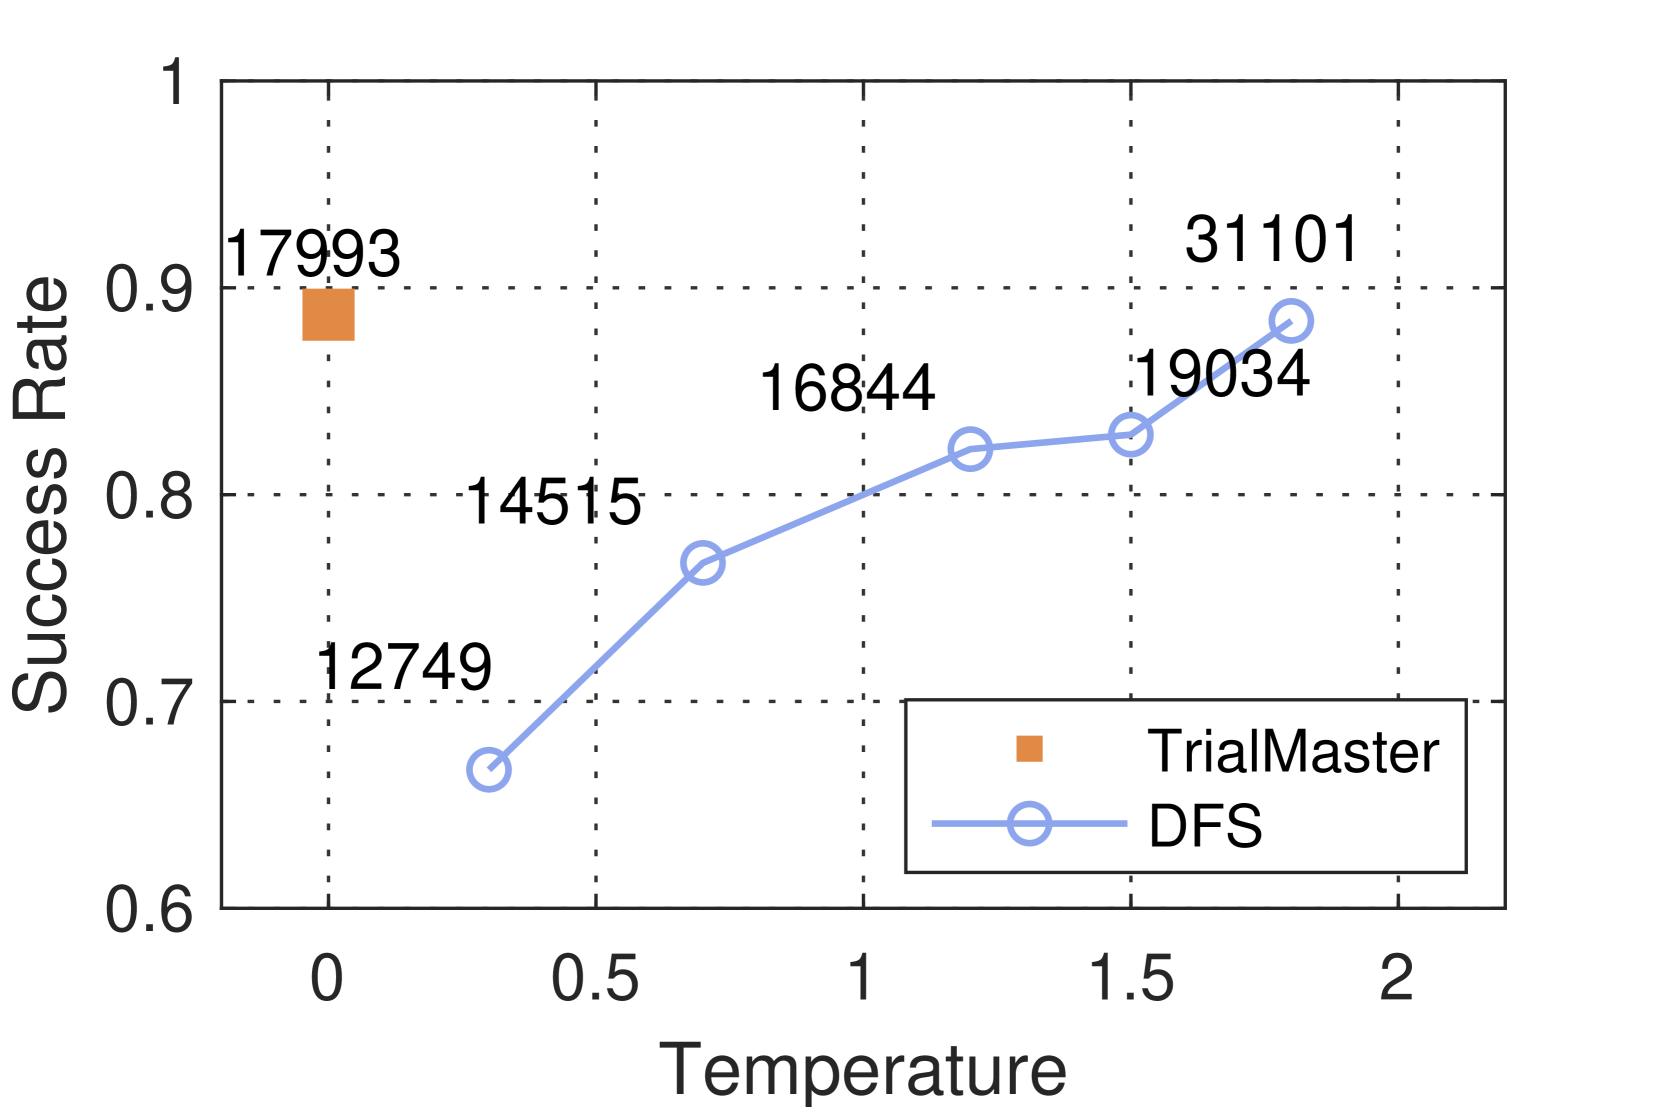
The image is a line chart comparing the success rate of two methods, "TrialMaster" and "DFS", across varying temperatures. The chart displays success rate on the y-axis and temperature on the x-axis. Data points are labeled with numerical values.
### Components/Axes
* **X-axis:** Temperature, ranging from 0 to 2 in increments of 0.5.
* **Y-axis:** Success Rate, ranging from 0.6 to 1 in increments of 0.1.
* **Legend:** Located in the bottom-right corner, it identifies the two data series:
* TrialMaster (represented by an orange square)
* DFS (represented by a blue line with circle markers)
* **Gridlines:** Dotted gridlines are present to aid in reading values.
### Detailed Analysis
* **TrialMaster:**
* The TrialMaster data consists of a single point at Temperature 0, with a Success Rate of approximately 0.89. The data point is labeled "17993".
* **DFS:**
* The DFS data series shows an upward trend as temperature increases.
* At Temperature 0.0, the Success Rate is approximately 0.67, labeled "12749".
* At Temperature 0.5, the Success Rate is approximately 0.76, labeled "14515".
* At Temperature 1.0, the Success Rate is approximately 0.83, labeled "16844".
* At Temperature 1.5, the Success Rate is approximately 0.84, labeled "19034".
* At Temperature 2.0, the Success Rate is approximately 0.88, labeled "31101".
### Key Observations
* TrialMaster has only one data point at temperature 0.
* DFS shows a positive correlation between temperature and success rate. The success rate increases as the temperature increases.
* The most significant increase in success rate for DFS occurs between temperatures 0 and 1.
### Interpretation
The chart suggests that the DFS method's performance, as measured by success rate, improves with increasing temperature within the tested range. TrialMaster's performance is only measured at a temperature of 0, making it difficult to compare its performance across different temperatures. The numbers associated with each data point (e.g., 12749, 14515) likely represent the number of trials or iterations performed at each temperature. The TrialMaster data point at temperature 0 has a success rate of 0.89, with 17993 trials.