\n
## Line Chart: Success Rate vs. Temperature
### Overview
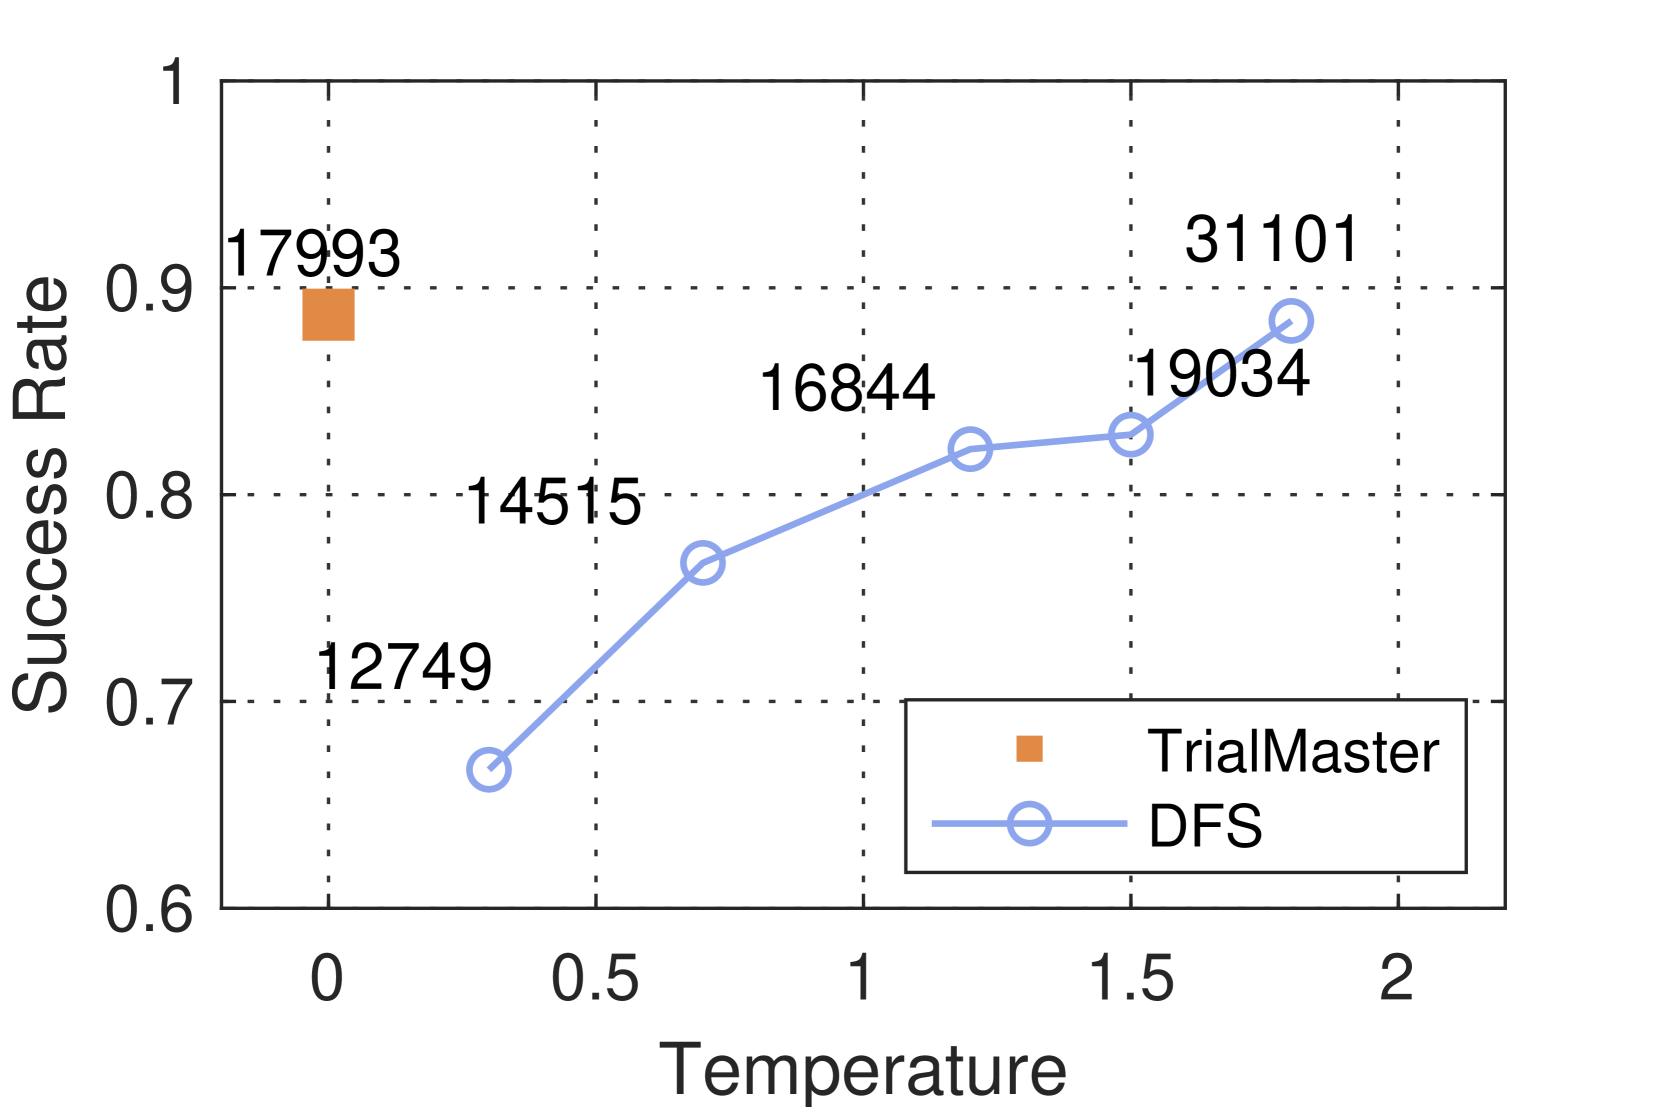
This image presents a line chart comparing the success rate of two algorithms, "TrialMaster" and "DFS" (Depth-First Search), across a range of temperatures. The chart displays success rate on the y-axis and temperature on the x-axis. Data points are labeled with numerical values representing the success rate at each temperature.
### Components/Axes
* **X-axis:** Temperature, ranging from approximately 0 to 2, with tick marks at 0, 0.5, 1, 1.5, and 2.
* **Y-axis:** Success Rate, ranging from 0.6 to 1, with tick marks at 0.6, 0.7, 0.8, 0.9, and 1.
* **Data Series 1:** "TrialMaster" - Represented by orange square markers.
* **Data Series 2:** "DFS" - Represented by blue circle markers with a line connecting them.
* **Legend:** Located in the bottom-right corner, identifying the colors and labels for each data series.
### Detailed Analysis
**TrialMaster (Orange Squares):**
The TrialMaster data consists of a single data point.
* Temperature = 0, Success Rate = 17993 (approximately 0.9).
**DFS (Blue Circles & Line):**
The DFS data shows a clear upward trend as temperature increases. The line slopes upward from left to right.
* Temperature = 0, Success Rate = 12749 (approximately 0.7).
* Temperature = 0.5, Success Rate = 14515 (approximately 0.8).
* Temperature = 1, Success Rate = 16844 (approximately 0.85).
* Temperature = 1.5, Success Rate = 19034 (approximately 0.87).
* Temperature = 2, Success Rate = 31101 (approximately 0.92).
### Key Observations
* At a temperature of 0, TrialMaster has a significantly higher success rate than DFS.
* DFS demonstrates a consistent increase in success rate as the temperature increases.
* At a temperature of 2, DFS surpasses TrialMaster in success rate.
* The success rate values are very large numbers, which is unusual and may indicate a scaling factor or a different unit of measurement than a simple percentage.
### Interpretation
The chart suggests that the DFS algorithm is more sensitive to temperature changes than the TrialMaster algorithm. At lower temperatures, TrialMaster performs better, but as the temperature increases, DFS becomes more effective and eventually outperforms TrialMaster. The large numerical values for success rate are peculiar and require further investigation to understand their meaning. It's possible these numbers represent counts of successful trials rather than probabilities. The consistent upward trend of DFS indicates a positive correlation between temperature and its performance, potentially due to increased exploration or better convergence at higher temperatures. The single data point for TrialMaster makes it difficult to draw conclusions about its behavior across a wider temperature range. The chart highlights a trade-off between the two algorithms, with the optimal choice depending on the operating temperature.