## Line Graph: Coalition Exploitability
### Overview
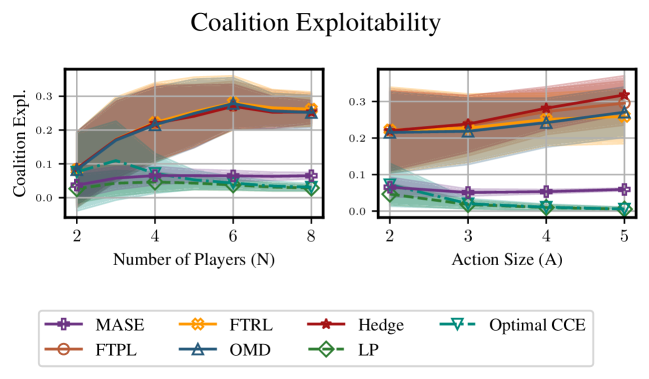
The image contains two side-by-side line graphs comparing coalition exploitability across different algorithms. The left subplot varies the **Number of Players (N)** from 2 to 8, while the right subplot varies **Action Size (A)** from 2 to 5. The y-axis, labeled "Coalition Expl.", measures exploitability on a scale from 0 to 0.3. Shaded regions around each line represent confidence intervals.
---
### Components/Axes
- **Left Subplot (Number of Players, N):**
- X-axis: "Number of Players (N)" with markers at 2, 4, 6, 8.
- Y-axis: "Coalition Expl." (0 to 0.3).
- Legend: 7 algorithms with distinct colors/markers:
- MASE: Purple cross (`+`)
- FTRL: Orange star (`★`)
- Hedge: Red star (`★`)
- OMD: Blue triangle (`△`)
- LP: Green diamond (`◇`)
- FTTPL: Brown circle (`●`)
- Optimal CCE: Teal inverted triangle (`▼`)
- **Right Subplot (Action Size, A):**
- X-axis: "Action Size (A)" with markers at 2, 3, 4, 5.
- Y-axis: Same as left subplot.
- Legend: Same algorithms as above.
---
### Detailed Analysis
#### Left Subplot (N = 2–8)
- **Hedge (Red ★):** Steep upward trend, reaching ~0.25 at N=8. Confidence interval widens significantly (0.15–0.35).
- **FTRL (Orange ★):** Gradual increase to ~0.22 at N=8. Confidence interval narrows (0.1–0.25).
- **MASE (Purple ✗):** Flat line (~0.08–0.12). Minimal variance.
- **OMD (Blue △):** Slight rise to ~0.1 at N=8. Confidence interval stable (0.05–0.15).
- **LP (Green ◇):** Near-zero values (<0.05) across all N. Minimal shading.
- **FTTPL (Brown ●):** Similar to LP, with values <0.05.
- **Optimal CCE (Teal ▼):** Slight decline from ~0.1 to 0.05. Confidence interval narrows.
#### Right Subplot (A = 2–5)
- **Hedge (Red ★):** Sharp increase to ~0.3 at A=5. Confidence interval widens (0.2–0.35).
- **FTRL (Orange ★):** Moderate rise to ~0.25 at A=5. Confidence interval stable (0.15–0.25).
- **MASE (Purple ✗):** Flat (~0.07–0.09). Minimal shading.
- **OMD (Blue △):** Slight decline to ~0.06 at A=5. Confidence interval narrows.
- **LP (Green ◇):** Near-zero values (<0.03). Minimal shading.
- **FTTPL (Brown ●):** Similar to LP, with values <0.03.
- **Optimal CCE (Teal ▼):** Slight decline from ~0.1 to 0.04. Confidence interval narrows.
---
### Key Observations
1. **Hedge** consistently exhibits the highest exploitability in both subplots, with values exceeding 0.25 in the left subplot and approaching 0.3 in the right.
2. **LP** and **FTTPL** show the lowest exploitability, remaining below 0.05 in both subplots.
3. **MASE** and **OMD** demonstrate moderate stability, with values below 0.15 in both subplots.
4. Confidence intervals widen for **Hedge** as N/A increases, indicating higher uncertainty in its performance under complexity.
5. **Optimal CCE** shows the most robust performance, with exploitability declining as N/A increases.
---
### Interpretation
The data suggests that **Hedge** is the least robust algorithm in coalition settings, with exploitability increasing sharply as the number of players or action size grows. This may reflect its inability to adapt to complex interactions. Conversely, **LP** and **FTTPL** appear highly robust, maintaining near-zero exploitability. The **Optimal CCE** algorithm demonstrates superior adaptability, with exploitability decreasing as complexity increases. These trends highlight trade-offs between algorithmic simplicity and robustness in dynamic, multi-agent environments. The widening confidence intervals for **Hedge** underscore the need for further investigation into its stability under varying conditions.