\n
## Line Chart: Model Learning Curves
### Overview
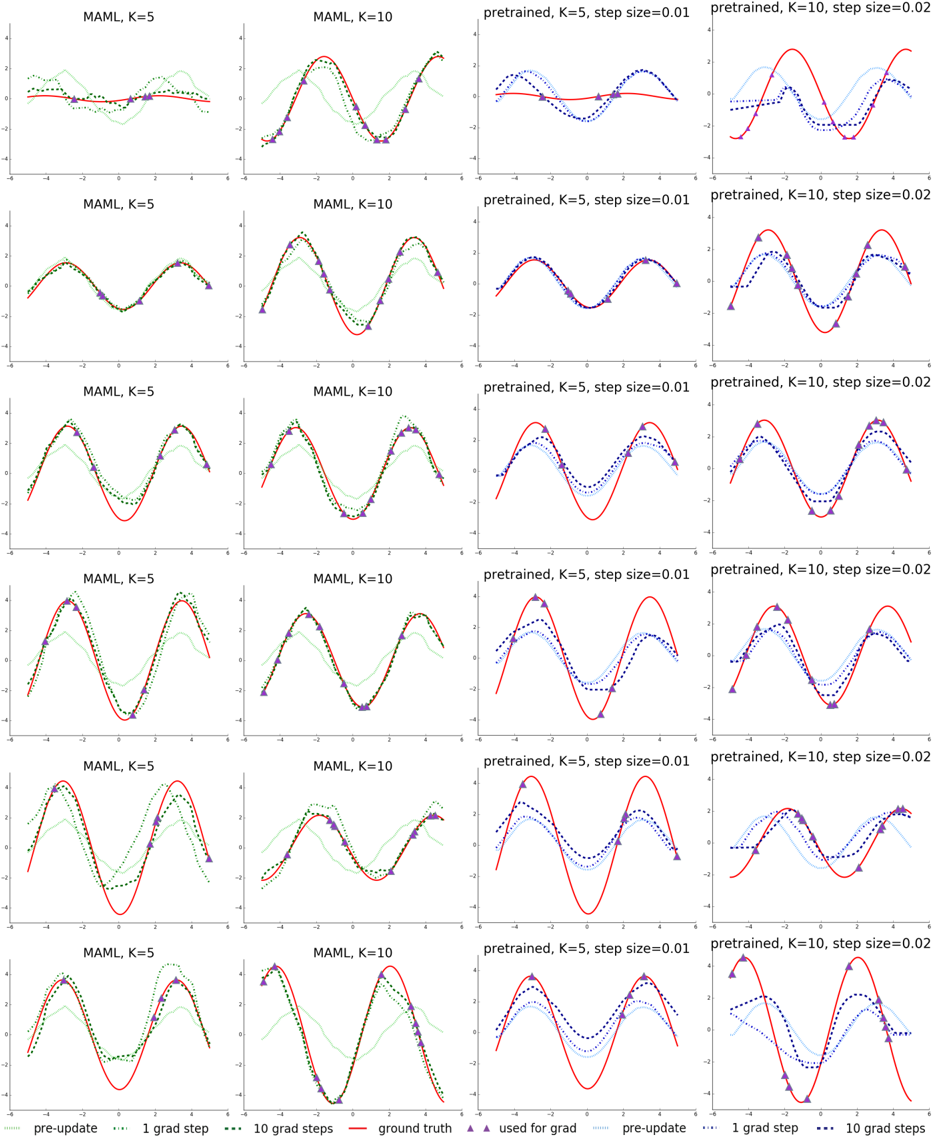
The image presents a grid of line charts illustrating the learning curves of different models under varying conditions. The charts depict the model's performance (likely error or loss) over a series of gradient steps. There are two main model types: "MAML" and "pretrained", each with different values for 'K' (5 and 10) and 'step size' (0.01 and 0.02). The charts compare the performance of the models before updates ("pre-update"), after 1 gradient step, and after 10 gradient steps, against a "ground truth" baseline.
### Components/Axes
* **X-axis:** Represents the gradient steps, ranging from approximately 0 to 10. The axis is labeled "gradient steps".
* **Y-axis:** Represents the model's performance metric (likely error or loss). The scale is not explicitly labeled, but appears to range from approximately 0 to 1.
* **Legend:** Located at the bottom of the image, it defines the line styles and colors:
* `pre-update` (dotted teal line)
* `1 grad step` (dashed orange line)
* `10 grad steps` (solid red line)
* `ground truth` (solid purple line)
* `used for grad` (dotted blue line)
* **Titles:** Each chart has a title indicating the model type, K value, and step size. Examples: "MAML, K=5", "MAML, K=10", "pretrained, K=5, step size=0.01", "pretrained, K=10, step size=0.02".
* **Grid:** The charts are arranged in a 6x4 grid.
### Detailed Analysis or Content Details
The image contains 24 individual line charts. Here's a breakdown of the trends and approximate data points, organized by model type and parameters:
**MAML, K=5:**
* The "pre-update" line (teal) starts around 0.8 and remains relatively stable around 0.8 throughout the gradient steps.
* The "1 grad step" line (orange) initially decreases to around 0.6, then fluctuates between 0.6 and 0.8.
* The "10 grad steps" line (red) shows a more pronounced decrease, reaching approximately 0.4 at step 10.
* The "ground truth" line (purple) is consistently around 0.2.
* The "used for grad" line (blue) starts around 0.7 and decreases to around 0.5.
**MAML, K=10:**
* The "pre-update" line (teal) starts around 0.8 and remains relatively stable around 0.8.
* The "1 grad step" line (orange) initially decreases to around 0.6, then fluctuates between 0.6 and 0.8.
* The "10 grad steps" line (red) shows a more pronounced decrease, reaching approximately 0.4 at step 10.
* The "ground truth" line (purple) is consistently around 0.2.
* The "used for grad" line (blue) starts around 0.7 and decreases to around 0.5.
**pretrained, K=5, step size=0.01:**
* The "pre-update" line (teal) starts around 0.6 and remains relatively stable around 0.6.
* The "1 grad step" line (orange) initially decreases to around 0.4, then fluctuates between 0.4 and 0.6.
* The "10 grad steps" line (red) shows a more pronounced decrease, reaching approximately 0.2 at step 10.
* The "ground truth" line (purple) is consistently around 0.2.
* The "used for grad" line (blue) starts around 0.5 and decreases to around 0.3.
**pretrained, K=10, step size=0.02:**
* The "pre-update" line (teal) starts around 0.6 and remains relatively stable around 0.6.
* The "1 grad step" line (orange) initially decreases to around 0.4, then fluctuates between 0.4 and 0.6.
* The "10 grad steps" line (red) shows a more pronounced decrease, reaching approximately 0.2 at step 10.
* The "ground truth" line (purple) is consistently around 0.2.
* The "used for grad" line (blue) starts around 0.5 and decreases to around 0.3.
The patterns are consistent across all charts. The "10 grad steps" line consistently performs better than the "1 grad step" line, and both improve relative to the "pre-update" line. All models are striving to reach the "ground truth" performance level.
### Key Observations
* The "ground truth" line remains constant across all charts, providing a benchmark for model performance.
* Increasing the number of gradient steps (from 1 to 10) consistently improves model performance.
* The "pre-update" performance is relatively stable, suggesting the initial model parameters are not well-suited for the task.
* The "used for grad" line appears to converge towards the "10 grad steps" line, indicating that the gradient updates are moving the model towards better performance.
* The MAML and pretrained models exhibit similar learning curves, suggesting that the choice of model architecture may not be the primary factor influencing performance.
### Interpretation
The data suggests that both MAML and pretrained models benefit from gradient-based learning. The learning curves demonstrate that increasing the number of gradient steps leads to improved performance, as measured by the decreasing error or loss. The consistent "ground truth" line provides a clear target for the models to achieve. The fact that both model types exhibit similar learning curves suggests that the learning process is relatively independent of the initial model architecture, and that the choice of hyperparameters (K and step size) may be more important. The "used for grad" line's convergence indicates the gradient descent is functioning as expected. The consistent gap between the best performing model ("10 grad steps") and the "ground truth" suggests there is still room for improvement, potentially through further optimization of hyperparameters or model architecture. The charts provide a visual representation of the learning process, allowing for a comparison of different models and configurations.