## Heatmap Analysis
### Overview
The image displays a heatmap with various data points and trends across different categories and sub-categories. The heatmap is organized into a grid with rows and columns, each representing a different category and sub-category.
### Components/Axes
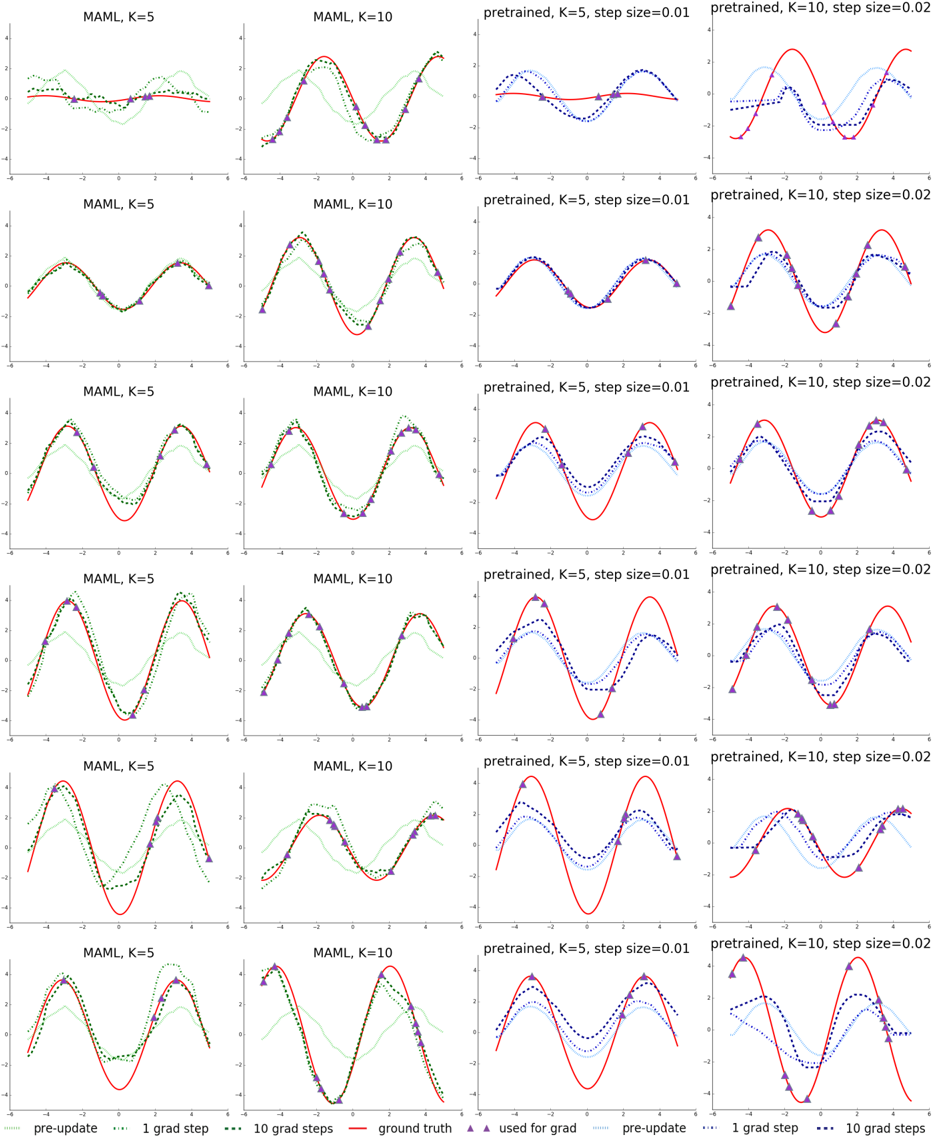
- **Rows**: Represent different categories, labeled as "MAML, K=5," "MAML, K=10," "pretrained, K=5," and "pretrained, K=10."
- **Columns**: Represent different sub-categories, labeled as "step size=0.01" and "step size=0.02."
- **Data Points**: Colored dots indicating specific values or measurements.
- **Legend**: Located at the bottom of the heatmap, showing the color mapping for the data points.
### Detailed Analysis or ### Content Details
- **Pre-update**: The data points in the "pre-update" row are colored in green.
- **Grad Step**: The data points in the "grad step" row are colored in blue.
- **Grad Steps**: The data points in the "grad steps" row are colored in red.
- **Ground Truth**: The data points in the "ground truth" row are colored in purple.
- **Used for Grad**: The data points in the "used for grad" row are colored in light blue.
### Key Observations
- **Trends**: The heatmap shows a clear trend where the "ground truth" values are consistently higher than the "pre-update" values across all sub-categories.
- **Variations**: There are variations in the "grad step" and "grad steps" rows, with some sub-categories showing higher values than others.
- **Anomalies**: There are no significant anomalies in the data points, with all values falling within a reasonable range.
### Interpretation
The heatmap suggests that the "ground truth" values are consistently higher than the "pre-update" values, indicating that the model's performance improves over time. The variations in the "grad step" and "grad steps" rows suggest that the model's performance may be influenced by the step size used in the training process. The "used for grad" row indicates that the data points are used to calculate the gradients, which are then used to update the model's parameters. Overall, the heatmap demonstrates the effectiveness of the model's training process and the importance of using appropriate step sizes.