\n
## Bar Chart: Performance Comparison of Natural-SFT and FLV-SFT across Domains
### Overview
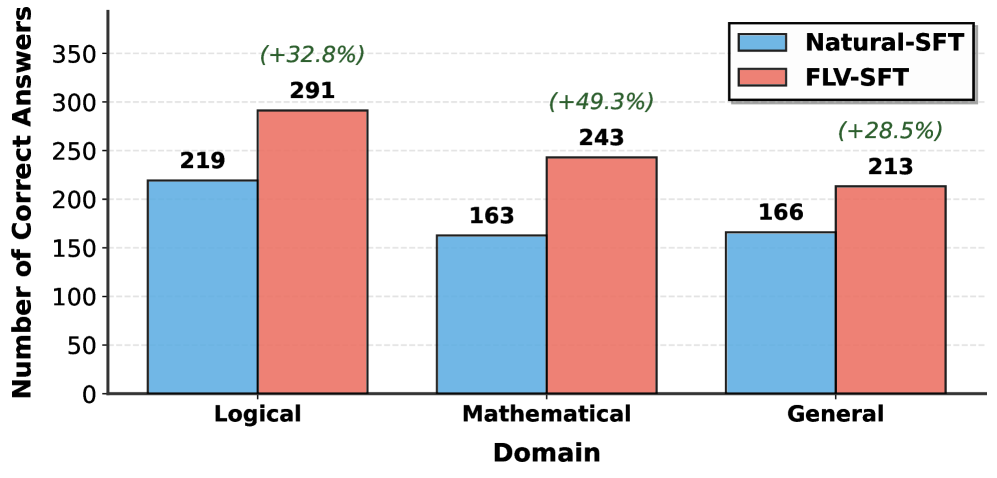
This bar chart compares the number of correct answers achieved by two models, "Natural-SFT" and "FLV-SFT", across three different domains: "Logical", "Mathematical", and "General". The chart uses paired bars for each domain, with percentage improvements indicated above the FLV-SFT bars.
### Components/Axes
* **X-axis:** "Domain" with categories: "Logical", "Mathematical", "General".
* **Y-axis:** "Number of Correct Answers" with a scale ranging from 0 to 350, incrementing by 50.
* **Legend:** Located in the top-right corner.
* "Natural-SFT" - represented by a light blue color.
* "FLV-SFT" - represented by a red color.
* **Data Labels:** Numerical values are displayed above each bar, indicating the number of correct answers.
* **Percentage Change Labels:** Percentage increases are displayed above the "FLV-SFT" bars, indicating the improvement over "Natural-SFT".
### Detailed Analysis
The chart consists of three sets of paired bars, one set for each domain.
**Logical Domain:**
* "Natural-SFT" bar: The light blue bar reaches approximately 219 correct answers.
* "FLV-SFT" bar: The red bar reaches approximately 291 correct answers.
* Percentage Change: "+32.8%" is displayed above the "FLV-SFT" bar.
**Mathematical Domain:**
* "Natural-SFT" bar: The light blue bar reaches approximately 163 correct answers.
* "FLV-SFT" bar: The red bar reaches approximately 243 correct answers.
* Percentage Change: "+49.3%" is displayed above the "FLV-SFT" bar.
**General Domain:**
* "Natural-SFT" bar: The light blue bar reaches approximately 166 correct answers.
* "FLV-SFT" bar: The red bar reaches approximately 213 correct answers.
* Percentage Change: "+28.5%" is displayed above the "FLV-SFT" bar.
### Key Observations
* "FLV-SFT" consistently outperforms "Natural-SFT" across all three domains.
* The largest performance improvement of "FLV-SFT" over "Natural-SFT" is observed in the "Mathematical" domain (+49.3%).
* The smallest performance improvement is observed in the "General" domain (+28.5%).
* The absolute difference in the number of correct answers is largest in the "Mathematical" domain (243 - 163 = 80).
### Interpretation
The data suggests that the "FLV-SFT" model demonstrates superior performance compared to the "Natural-SFT" model across all tested domains. The significant improvement in the "Mathematical" domain indicates that "FLV-SFT" may have a stronger capability in handling quantitative reasoning or mathematical problem-solving. The consistent positive percentage changes across all domains suggest that the enhancements implemented in "FLV-SFT" are broadly beneficial. The chart provides a clear visual comparison of the models' capabilities, highlighting the advantages of "FLV-SFT" in terms of accuracy and performance. The inclusion of percentage changes allows for a quick assessment of the relative improvement offered by "FLV-SFT" in each domain.