# Technical Document Extraction
## Line Chart Analysis
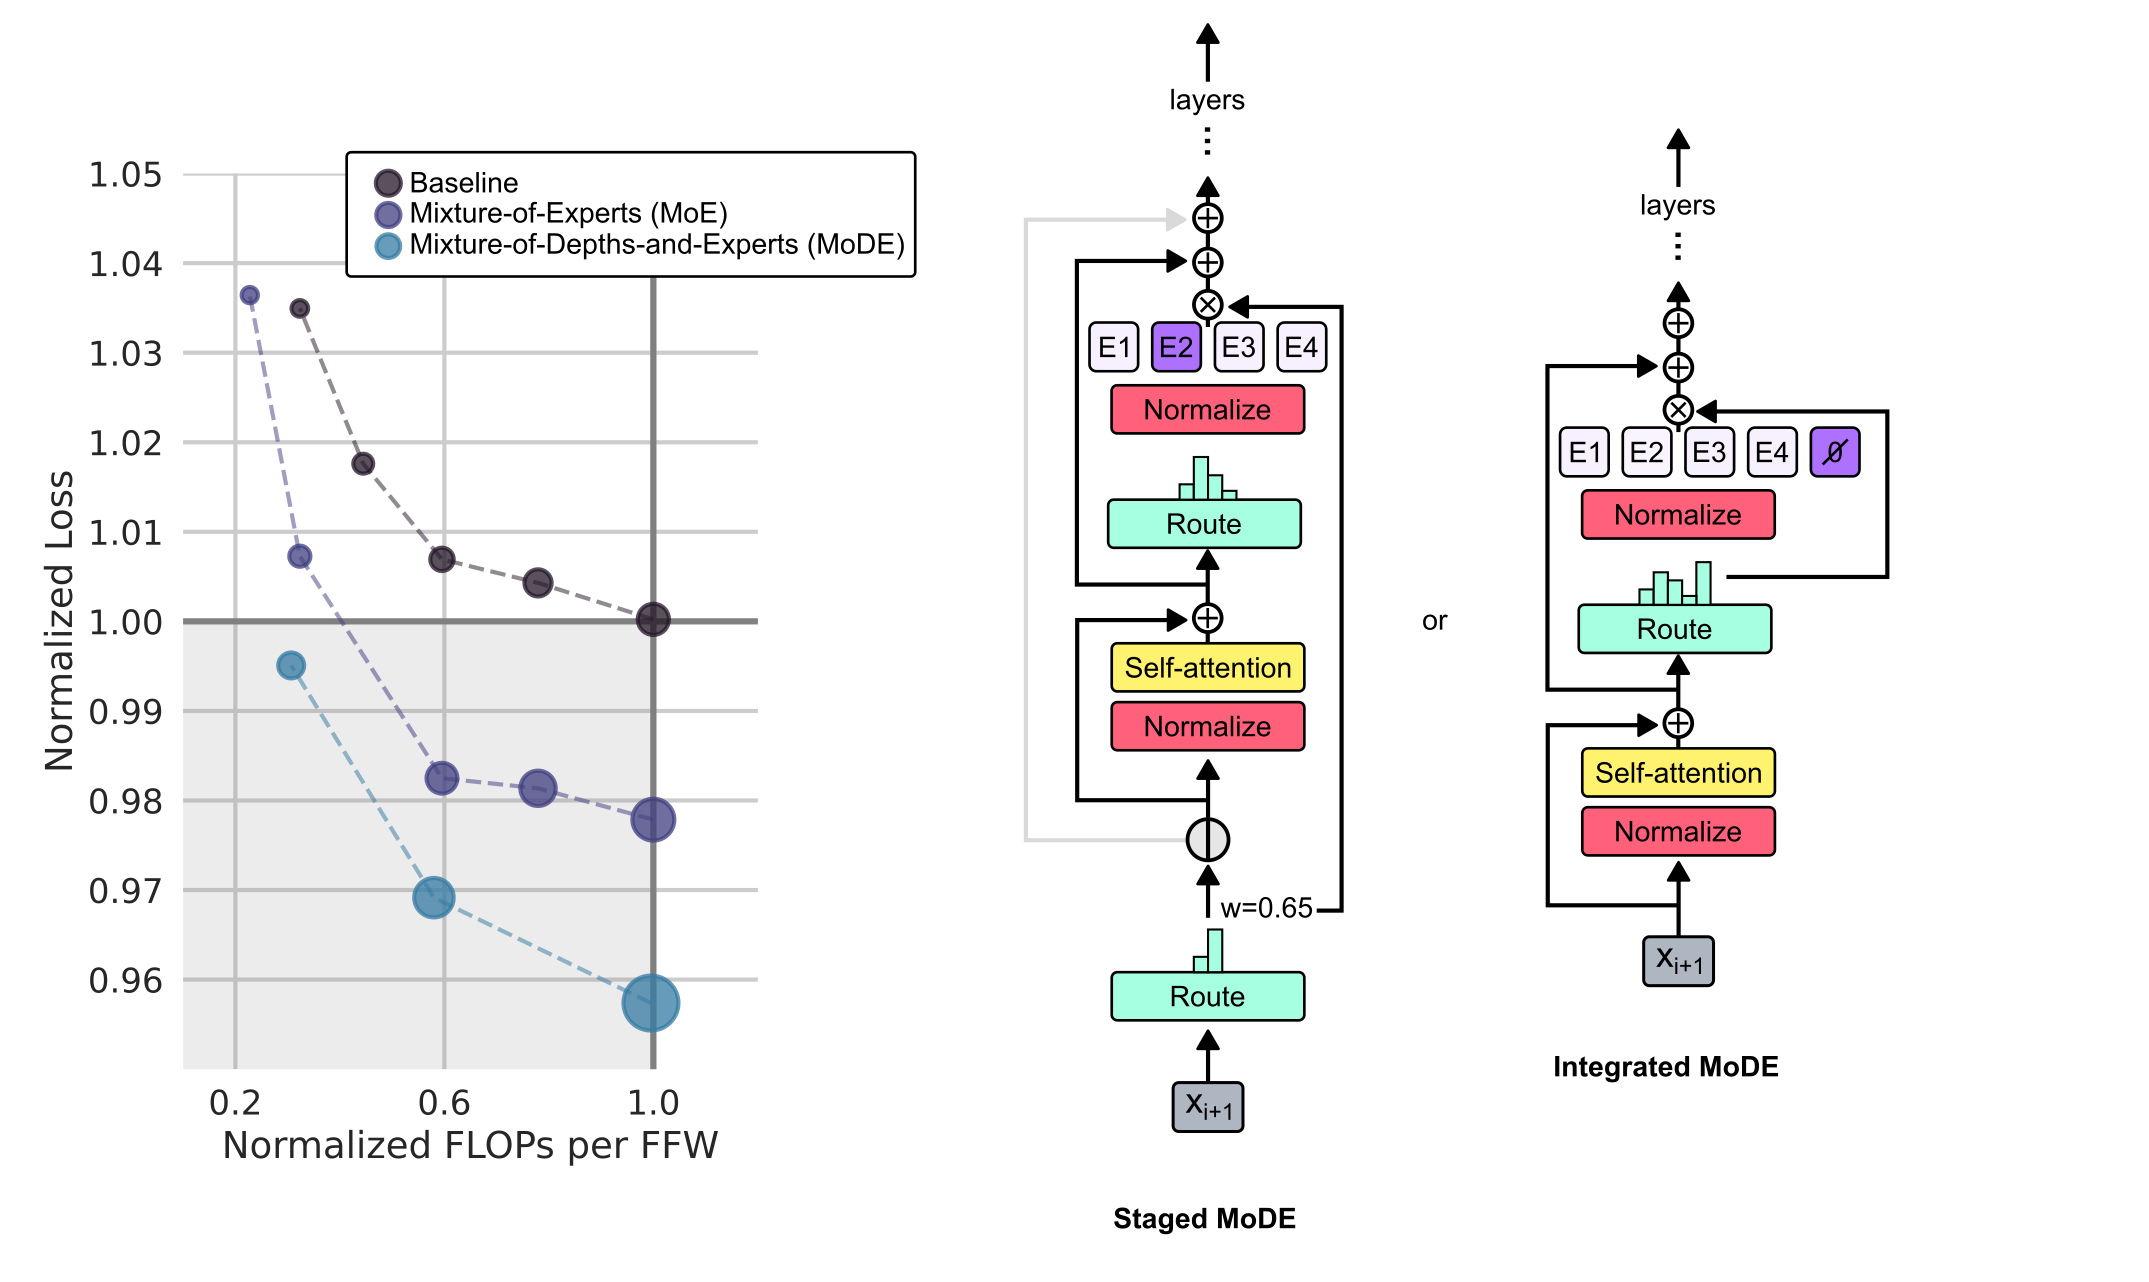
### Axes
- **X-axis**: "Normalized FLOPs per FFW"
- Markers: 0.2, 0.6, 1.0
- **Y-axis**: "Normalized Loss"
- Range: 0.96 to 1.05
### Legend
1. **Baseline**
- Color: Black
- Line Style: Dashed
- Markers: Present
2. **Mixture-of-Experts (MoE)**
- Color: Blue
- Line Style: Solid
- Markers: Present
3. **Mixture-of-Depths-and-Experts (MoDE)**
- Color: Teal
- Line Style: Dashed
- Markers: Present
### Key Data Points
- **Baseline**
- (0.2, 1.035)
- (0.6, 1.01)
- (1.0, 1.00)
- **MoE**
- (0.2, 1.035)
- (0.6, 0.98)
- (1.0, 0.96)
- **MoDE**
- (0.2, 0.995)
- (0.6, 0.97)
- (1.0, 0.96)
### Observations
- **Baseline** shows a steady decline in loss as FLOPs increase.
- **MoE** demonstrates the steepest improvement, reducing loss by ~7% at 1.0 FLOPs.
- **MoDE** achieves comparable performance to MoE but with slightly higher loss at lower FLOPs.
- Shaded gray area represents the performance gap between Baseline and MoE.
---
## Diagrams Analysis
### 1. Staged MoDE
#### Components
- **Layers**: E1, E2 (highlighted), E3, E4
- **Blocks**:
- **Normalize** (red)
- **Route** (green)
- **Self-attention** (yellow)
- **Flow**:
- Input → Normalize → Route → Self-attention → Output (`X_{i+1}`)
- Loop weight: `w = 0.65`
### 2. Integrated MoDE
#### Components
- **Layers**: E1, E2, E3, E4 (highlighted)
- **Blocks**:
- **Normalize** (red)
- **Route** (green)
- **Self-attention** (yellow)
- **Flow**:
- Input → Normalize → Route → Self-attention → Output (`X_{i+1}`)
- No explicit loop weight shown
### Key Differences
- **Staged MoDE**: Explicit loop with `w = 0.65`; E2 highlighted.
- **Integrated MoDE**: No loop weight; E4 highlighted.
---
## Cross-Reference Validation
- **Legend Colors**:
- Black (Baseline) matches dashed black line.
- Blue (MoE) matches solid blue line.
- Teal (MoDE) matches dashed teal line.
- **Data Consistency**: All plotted points align with legend labels.