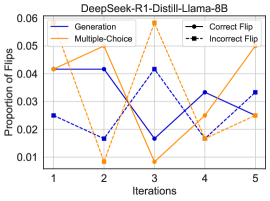
## Chart: Proportion of Flips vs. Iterations for DeepSeek-R1-Distill-Llama-8B
### Overview
The image is a line chart comparing the proportion of flips across iterations for two different methods: Generation and Multiple-Choice. It also distinguishes between correct and incorrect flips. The chart title is "DeepSeek-R1-Distill-Llama-8B".
### Components/Axes
* **Title:** DeepSeek-R1-Distill-Llama-8B
* **X-axis:** Iterations (labeled 1 to 5)
* **Y-axis:** Proportion of Flips (ranging from 0.01 to 0.06)
* **Legend:** Located at the top-left and top-right of the chart.
* **Generation:** Solid dark blue line
* **Multiple-Choice:** Solid orange line
* **Correct Flip:** Solid black line with circle markers
* **Incorrect Flip:** Dashed black line with square markers
### Detailed Analysis
* **Generation (Solid Dark Blue Line):**
* Trend: Starts at approximately 0.042, decreases to approximately 0.017 at iteration 3, increases to approximately 0.033 at iteration 4, and ends at approximately 0.033 at iteration 5.
* Data Points:
* Iteration 1: ~0.042
* Iteration 2: ~0.042
* Iteration 3: ~0.017
* Iteration 4: ~0.033
* Iteration 5: ~0.033
* **Multiple-Choice (Solid Orange Line):**
* Trend: Starts at approximately 0.042, decreases to approximately 0.008 at iteration 2, increases to approximately 0.058 at iteration 3, decreases to approximately 0.017 at iteration 4, and ends at approximately 0.025 at iteration 5.
* Data Points:
* Iteration 1: ~0.042
* Iteration 2: ~0.008
* Iteration 3: ~0.058
* Iteration 4: ~0.017
* Iteration 5: ~0.025
* **Correct Flip (Solid Black Line with Circle Markers):**
* Trend: Starts at approximately 0.025, decreases to approximately 0.016 at iteration 2, increases to approximately 0.041 at iteration 3, decreases to approximately 0.017 at iteration 4, and ends at approximately 0.033 at iteration 5.
* Data Points:
* Iteration 1: ~0.025
* Iteration 2: ~0.016
* Iteration 3: ~0.041
* Iteration 4: ~0.017
* Iteration 5: ~0.033
* **Incorrect Flip (Dashed Black Line with Square Markers):**
* Trend: Starts at approximately 0.041, decreases to approximately 0.008 at iteration 2, increases to approximately 0.058 at iteration 3, decreases to approximately 0.017 at iteration 4, and ends at approximately 0.025 at iteration 5.
* Data Points:
* Iteration 1: ~0.041
* Iteration 2: ~0.008
* Iteration 3: ~0.058
* Iteration 4: ~0.017
* Iteration 5: ~0.025
### Key Observations
* The proportion of flips varies significantly across iterations for both Generation and Multiple-Choice methods.
* The Multiple-Choice method shows a more drastic fluctuation in the proportion of flips compared to the Generation method.
* The "Correct Flip" and "Incorrect Flip" lines appear to mirror the "Generation" and "Multiple-Choice" lines, respectively, suggesting a correlation between the method and the type of flip.
### Interpretation
The chart illustrates the performance of the DeepSeek-R1-Distill-Llama-8B model in terms of the proportion of flips during different iterations, comparing Generation and Multiple-Choice methods. The fluctuations in the proportion of flips indicate the model's learning and adaptation process over iterations. The mirroring of the "Correct Flip" and "Incorrect Flip" lines with the "Generation" and "Multiple-Choice" lines suggests that the choice of method significantly influences the type of flips observed. The Multiple-Choice method, with its more drastic fluctuations, might be more sensitive to changes during the iterations, potentially leading to both higher proportions of incorrect flips and more significant improvements. The data suggests that the model's performance is not consistent across iterations and that the choice of method plays a crucial role in the type and frequency of flips.