## Line Chart: DeepSeek-R1-Distill-Llama-8B
### Overview
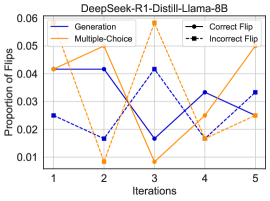
This is a line chart comparing the "Proportion of Flips" across five iterations for two different methods: "Generation" and "Multiple-Choice." Each method is further broken down into "Correct Flip" and "Incorrect Flip" categories, represented by solid and dashed lines, respectively. The chart shows significant volatility in the flip proportions for both methods over the measured iterations.
### Components/Axes
* **Chart Title:** "DeepSeek-R1-Distill-Llama-8B" (centered at the top).
* **X-Axis:** Labeled "Iterations." It has five discrete markers: 1, 2, 3, 4, and 5.
* **Y-Axis:** Labeled "Proportion of Flips." The scale ranges from 0.01 to 0.06, with major tick marks at 0.01, 0.02, 0.03, 0.04, 0.05, and 0.06.
* **Legend:** Located in the top-right corner of the plot area. It defines four series:
* **Generation (Blue):**
* Solid blue line: "Correct Flip"
* Dashed blue line: "Incorrect Flip"
* **Multiple-Choice (Orange):**
* Solid orange line: "Correct Flip"
* Dashed orange line: "Incorrect Flip"
### Detailed Analysis
**1. Generation (Blue Lines)**
* **Correct Flip (Solid Blue):** The trend is a sharp decline followed by a partial recovery.
* Iteration 1: ~0.042
* Iteration 2: ~0.042 (plateau)
* Iteration 3: ~0.015 (sharp drop)
* Iteration 4: ~0.033 (recovery)
* Iteration 5: ~0.025 (slight decline)
* **Incorrect Flip (Dashed Blue):** The trend is highly volatile, with a major peak at iteration 3.
* Iteration 1: ~0.025
* Iteration 2: ~0.015 (drop)
* Iteration 3: ~0.042 (peak)
* Iteration 4: ~0.015 (drop)
* Iteration 5: ~0.033 (rise)
**2. Multiple-Choice (Orange Lines)**
* **Correct Flip (Solid Orange):** The trend shows extreme volatility, with the highest peak on the chart.
* Iteration 1: ~0.042
* Iteration 2: ~0.008 (sharp drop, lowest point on chart)
* Iteration 3: ~0.060 (peak, highest point on chart)
* Iteration 4: ~0.015 (sharp drop)
* Iteration 5: ~0.025 (rise)
* **Incorrect Flip (Dashed Orange):** The trend mirrors the "Generation - Incorrect Flip" line closely.
* Iteration 1: ~0.042
* Iteration 2: ~0.015 (drop)
* Iteration 3: ~0.042 (peak)
* Iteration 4: ~0.015 (drop)
* Iteration 5: ~0.033 (rise)
### Key Observations
1. **Synchronized Peak at Iteration 3:** All four data series show a significant local peak or trough at iteration 3. The "Multiple-Choice - Correct Flip" reaches the chart's maximum value (~0.06), while the "Generation - Correct Flip" reaches its minimum (~0.015).
2. **Convergence at Start and End:** At iteration 1, both "Correct Flip" lines start at the same value (~0.042). At iteration 5, three of the four lines (all except "Generation - Correct Flip") converge at approximately 0.025-0.033.
3. **High Volatility:** The "Multiple-Choice - Correct Flip" series exhibits the most extreme swing, from ~0.008 to ~0.060 within two iterations.
4. **Correlation of Incorrect Flips:** The "Incorrect Flip" lines for both Generation and Multiple-Choice follow nearly identical paths, suggesting the rate of incorrect flips may be independent of the method used.
### Interpretation
The chart demonstrates that the "Proportion of Flips" for the DeepSeek-R1-Distill-Llama-8B model is highly sensitive to the iteration step, showing no stable trend. The dramatic spike in "Correct Flips" for the Multiple-Choice method at iteration 3 suggests a specific condition or event at that stage that significantly increased the model's propensity to change its answer correctly. Conversely, the same iteration saw a collapse in correct flips for the Generation method, indicating a divergent response between the two approaches.
The near-identical behavior of the "Incorrect Flip" lines implies that the underlying mechanism or error rate leading to incorrect answer changes is consistent across both methods. The overall pattern suggests an unstable training or evaluation process where performance metrics fluctuate widely between steps, making it difficult to ascertain a clear improvement trajectory from this data alone. The convergence of values at the final iteration might indicate a return to a baseline state after a period of high instability.