## Line Chart: Proportion of Flips Across Iterations for DeepSeek-R1-Distill-Llama-8B
### Overview
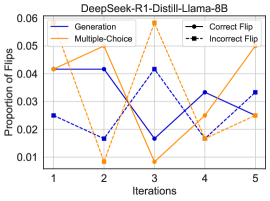
The chart visualizes the proportion of "flips" (likely model output changes) across five iterations for two methods: "Generation" (blue line) and "Multiple-Choice" (orange line). The y-axis represents the proportion of flips (0.01–0.06), and the x-axis represents iterations (1–5). A legend in the top-right corner labels the lines but includes ambiguous terms ("Correct Flip" and "Incorrect Flip") that do not align with the line styles.
### Components/Axes
- **Title**: "DeepSeek-R1-Distill-Llama-8B" (top-center).
- **X-axis**: "Iterations" (1–5, labeled at integer ticks).
- **Y-axis**: "Proportion of Flips" (0.01–0.06, increments of 0.01).
- **Legend**: Top-right corner, with:
- **Generation**: Solid blue line (no markers).
- **Multiple-Choice**: Solid orange line (no markers).
- **Correct Flip**: Solid black line (no corresponding line in the chart).
- **Incorrect Flip**: Dashed black line (no corresponding line in the chart).
### Detailed Analysis
#### Generation (Blue Line)
- **Iteration 1**: ~0.04 (solid blue line starts here).
- **Iteration 2**: ~0.02 (dips sharply).
- **Iteration 3**: ~0.04 (rises back to initial value).
- **Iteration 4**: ~0.02 (dips again).
- **Iteration 5**: ~0.03 (moderate increase).
#### Multiple-Choice (Orange Line)
- **Iteration 1**: ~0.04 (starts near Generation).
- **Iteration 2**: ~0.06 (peaks sharply).
- **Iteration 3**: ~0.01 (plummets to lowest value).
- **Iteration 4**: ~0.03 (moderate recovery).
- **Iteration 5**: ~0.05 (sharp rise to second-highest value).
### Key Observations
1. **Volatility**: The Multiple-Choice line exhibits extreme fluctuations (0.01–0.06), while Generation remains relatively stable (0.02–0.04).
2. **Crossing Points**: The lines intersect at Iteration 3 (~0.04 for both) and Iteration 4 (~0.02–0.03 overlap).
3. **Legend Mismatch**: The legend includes "Correct Flip" and "Incorrect Flip" labels, but no lines match these styles (solid/dashed black). This suggests a potential error in the chart's legend or data representation.
### Interpretation
- The data suggests that the "Multiple-Choice" method experiences significantly more variability in flip proportions across iterations compared to "Generation." The sharp peaks and troughs in the orange line could indicate instability or sensitivity to iteration-specific factors.
- The legend's inclusion of "Correct Flip" and "Incorrect Flip" is puzzling, as no lines correspond to these labels. This discrepancy may imply a mislabeling error or a conceptual mismatch between the data and the legend.
- The Generation method's stability might imply robustness in model output consistency, whereas the Multiple-Choice method's volatility could reflect higher uncertainty or dynamic behavior in its outputs.
### Spatial Grounding
- **Legend**: Top-right corner, aligned with the chart's upper boundary.
- **Lines**: Solid colors (blue/orange) without markers, occupying the central vertical space of the chart.
- **Axes**: Centered labels with gridlines for reference.
### Content Details
- **Numerical Approximations**:
- Generation: [0.04, 0.02, 0.04, 0.02, 0.03].
- Multiple-Choice: [0.04, 0.06, 0.01, 0.03, 0.05].
- **Trend Verification**:
- Generation: Slightly oscillatory but bounded between 0.02–0.04.
- Multiple-Choice: Highly erratic, with a peak-to-trough range of 0.05 (0.06–0.01).
### Final Notes
The chart highlights divergent behaviors between the two methods, with Multiple-Choice showing extreme sensitivity to iteration changes. The legend's ambiguity underscores the need for clarification on the definitions of "Correct Flip" and "Incorrect Flip" in this context.