## Multi-Chart: Question Analysis and Performance Metrics
### Overview
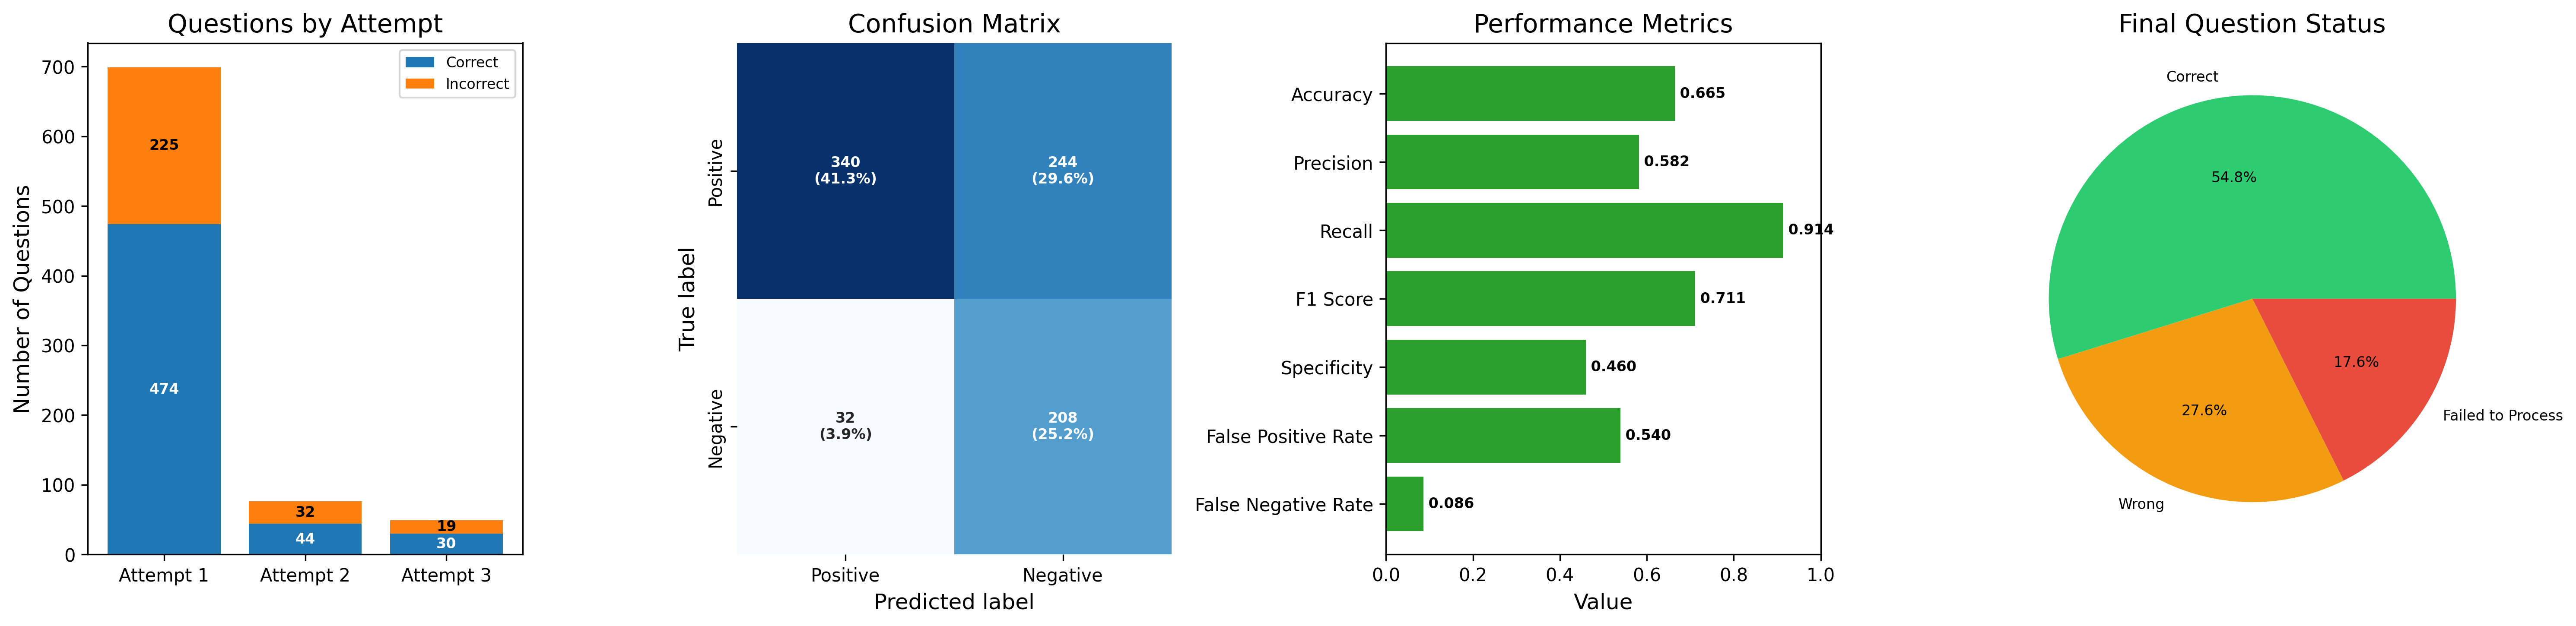
The image presents a series of four charts analyzing question attempts, a confusion matrix, performance metrics, and final question status. The charts provide insights into the accuracy and effectiveness of a question-answering system or process.
### Components/Axes
**1. Questions by Attempt (Stacked Bar Chart):**
* **Title:** Questions by Attempt
* **Y-axis:** Number of Questions (scale from 0 to 700)
* **X-axis:** Attempt (Attempt 1, Attempt 2, Attempt 3)
* **Legend:** Located at the top-right of the chart.
* Blue: Correct
* Orange: Incorrect
**2. Confusion Matrix (Heatmap):**
* **Title:** Confusion Matrix
* **Y-axis:** True label (Positive, Negative)
* **X-axis:** Predicted label (Positive, Negative)
* **Cells:**
* Top-left: True Positive
* Top-right: False Negative
* Bottom-left: False Negative
* Bottom-right: True Negative
**3. Performance Metrics (Horizontal Bar Chart):**
* **Title:** Performance Metrics
* **Y-axis:** Metrics (Accuracy, Precision, Recall, F1 Score, Specificity, False Positive Rate, False Negative Rate)
* **X-axis:** Value (scale from 0.0 to 1.0)
**4. Final Question Status (Pie Chart):**
* **Title:** Final Question Status
* **Categories:** Correct, Wrong, Failed to Process
### Detailed Analysis
**1. Questions by Attempt:**
* **Attempt 1:**
* Correct: 474
* Incorrect: 225
* **Attempt 2:**
* Correct: 44
* Incorrect: 32
* **Attempt 3:**
* Correct: 30
* Incorrect: 19
**Trend:** The number of questions attempted decreases significantly from Attempt 1 to Attempt 2 and then to Attempt 3. The number of correct answers also decreases with each attempt.
**2. Confusion Matrix:**
* **True Positive (Positive Predicted Positive):** 340 (41.3%)
* **False Negative (Positive Predicted Negative):** 244 (29.6%)
* **False Positive (Negative Predicted Positive):** 32 (3.9%)
* **True Negative (Negative Predicted Negative):** 208 (25.2%)
**3. Performance Metrics:**
* Accuracy: 0.665
* Precision: 0.582
* Recall: 0.914
* F1 Score: 0.711
* Specificity: 0.460
* False Positive Rate: 0.540
* False Negative Rate: 0.086
**4. Final Question Status:**
* Correct: 54.8%
* Wrong: 27.6%
* Failed to Process: 17.6%
### Key Observations
* The majority of questions are answered correctly on the first attempt.
* Recall is high (0.914), indicating that the system is good at identifying positive cases.
* Specificity is relatively low (0.460), suggesting that the system has difficulty identifying negative cases.
* The final question status shows that over half of the questions are answered correctly, while a significant portion are answered incorrectly or fail to process.
### Interpretation
The data suggests that the question-answering system performs well in terms of recall but could be improved in terms of specificity. The high number of correct answers on the first attempt indicates a good initial understanding of the questions. However, the decrease in correct answers on subsequent attempts suggests that the system may struggle with more complex or nuanced questions. The confusion matrix highlights the areas where the system is most likely to make errors, which can be used to guide further improvements. The final question status provides an overview of the overall performance of the system, indicating the proportion of questions that are answered correctly, incorrectly, or fail to process. The relatively high percentage of "Failed to Process" questions could indicate issues with data input, question formatting, or system errors.