\n
## Charts: Performance Analysis of Question Attempts
### Overview
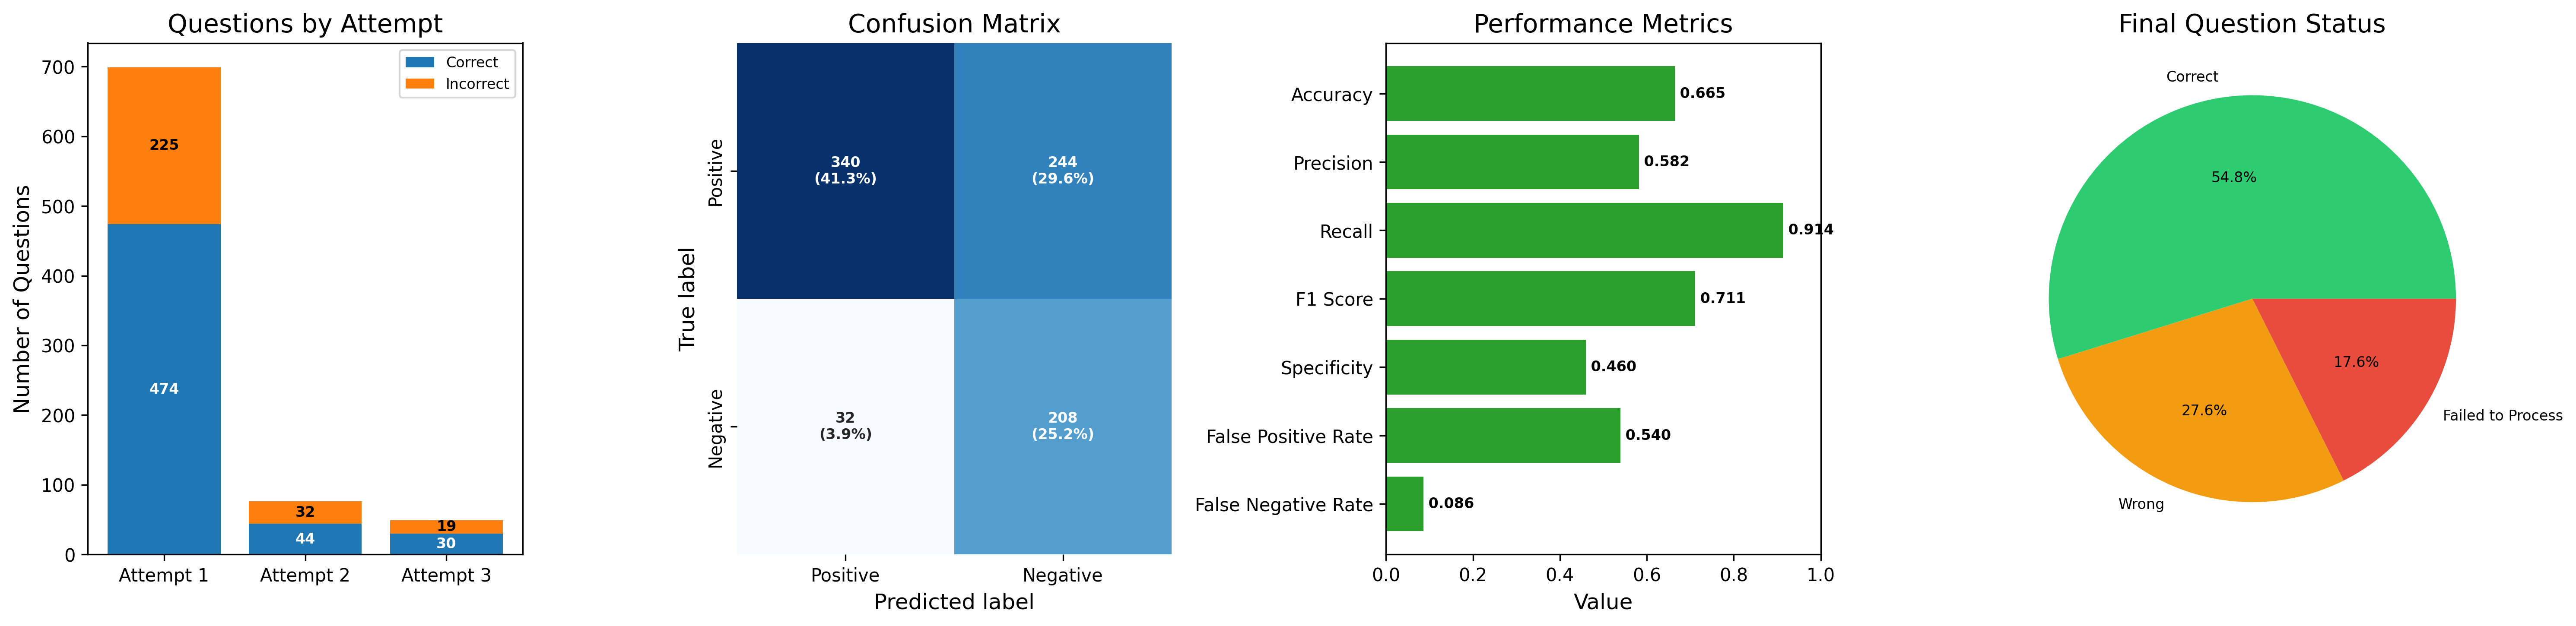
The image presents a series of four charts visualizing the performance of question attempts. The charts display the number of correct/incorrect answers per attempt, a confusion matrix, performance metrics (accuracy, precision, recall, F1 score, specificity, false positive rate, false negative rate), and the final status of questions (correct, wrong, failed to process).
### Components/Axes
* **Chart 1: Questions by Attempt**
* X-axis: Attempt (1, 2, 3)
* Y-axis: Number of Questions (Scale: 0 to 700, increments of 100)
* Legend:
* Blue: Correct
* Orange: Incorrect
* **Chart 2: Confusion Matrix**
* X-axis: Predicted label (Positive, Negative)
* Y-axis: True label (Positive, Negative)
* Cells contain counts and percentages.
* **Chart 3: Performance Metrics**
* X-axis: Value (Scale: 0.0 to 1.0, increments of 0.2)
* Y-axis: Metric Name (Accuracy, Precision, Recall, F1 Score, Specificity, False Positive Rate, False Negative Rate)
* Horizontal bars represent metric values.
* **Chart 4: Final Question Status**
* Pie chart showing the proportion of questions in each status.
* Legend:
* Green: Correct
* Red: Wrong
* Yellow: Failed to Process
### Detailed Analysis or Content Details
* **Chart 1: Questions by Attempt**
* Attempt 1: Approximately 474 correct, approximately 32 incorrect.
* Attempt 2: Approximately 225 correct, approximately 44 incorrect.
* Attempt 3: Approximately 19 correct, approximately 30 incorrect.
* The number of correct answers decreases significantly with each attempt, while the number of incorrect answers increases.
* **Chart 2: Confusion Matrix**
* Positive/Positive: 340 (41.3%)
* Positive/Negative: 244 (29.6%)
* Negative/Positive: 32 (3.9%)
* Negative/Negative: 208 (25.2%)
* **Chart 3: Performance Metrics**
* Accuracy: Approximately 0.665
* Precision: Approximately 0.582
* Recall: Approximately 0.914
* F1 Score: Approximately 0.711
* Specificity: Approximately 0.460
* False Positive Rate: Approximately 0.540
* False Negative Rate: Approximately 0.086
* **Chart 4: Final Question Status**
* Correct: 54.8%
* Wrong: 27.6%
* Failed to Process: 17.6%
### Key Observations
* The number of correct answers drops dramatically with each attempt.
* The confusion matrix shows a high number of true positives (340) but also a significant number of false negatives (244).
* Recall is high (0.914), indicating the model correctly identifies most positive cases.
* Precision is relatively low (0.582), suggesting a significant number of false positives.
* The "Failed to Process" category represents a notable portion (17.6%) of the questions.
### Interpretation
The data suggests a model that performs well at identifying positive cases (high recall) but struggles with precision, leading to a substantial number of false positives. The decreasing number of correct answers with each attempt is concerning and could indicate issues with the question set, the model's learning process, or the data distribution across attempts. The significant "Failed to Process" rate suggests potential problems with data input, processing, or model compatibility. The confusion matrix highlights a bias towards predicting positive outcomes, which explains the high recall and low precision. Further investigation is needed to understand the reasons behind the declining performance across attempts and the high failure rate. The model appears to be overly sensitive, flagging many instances as positive when they are actually negative.