# Technical Document Extraction
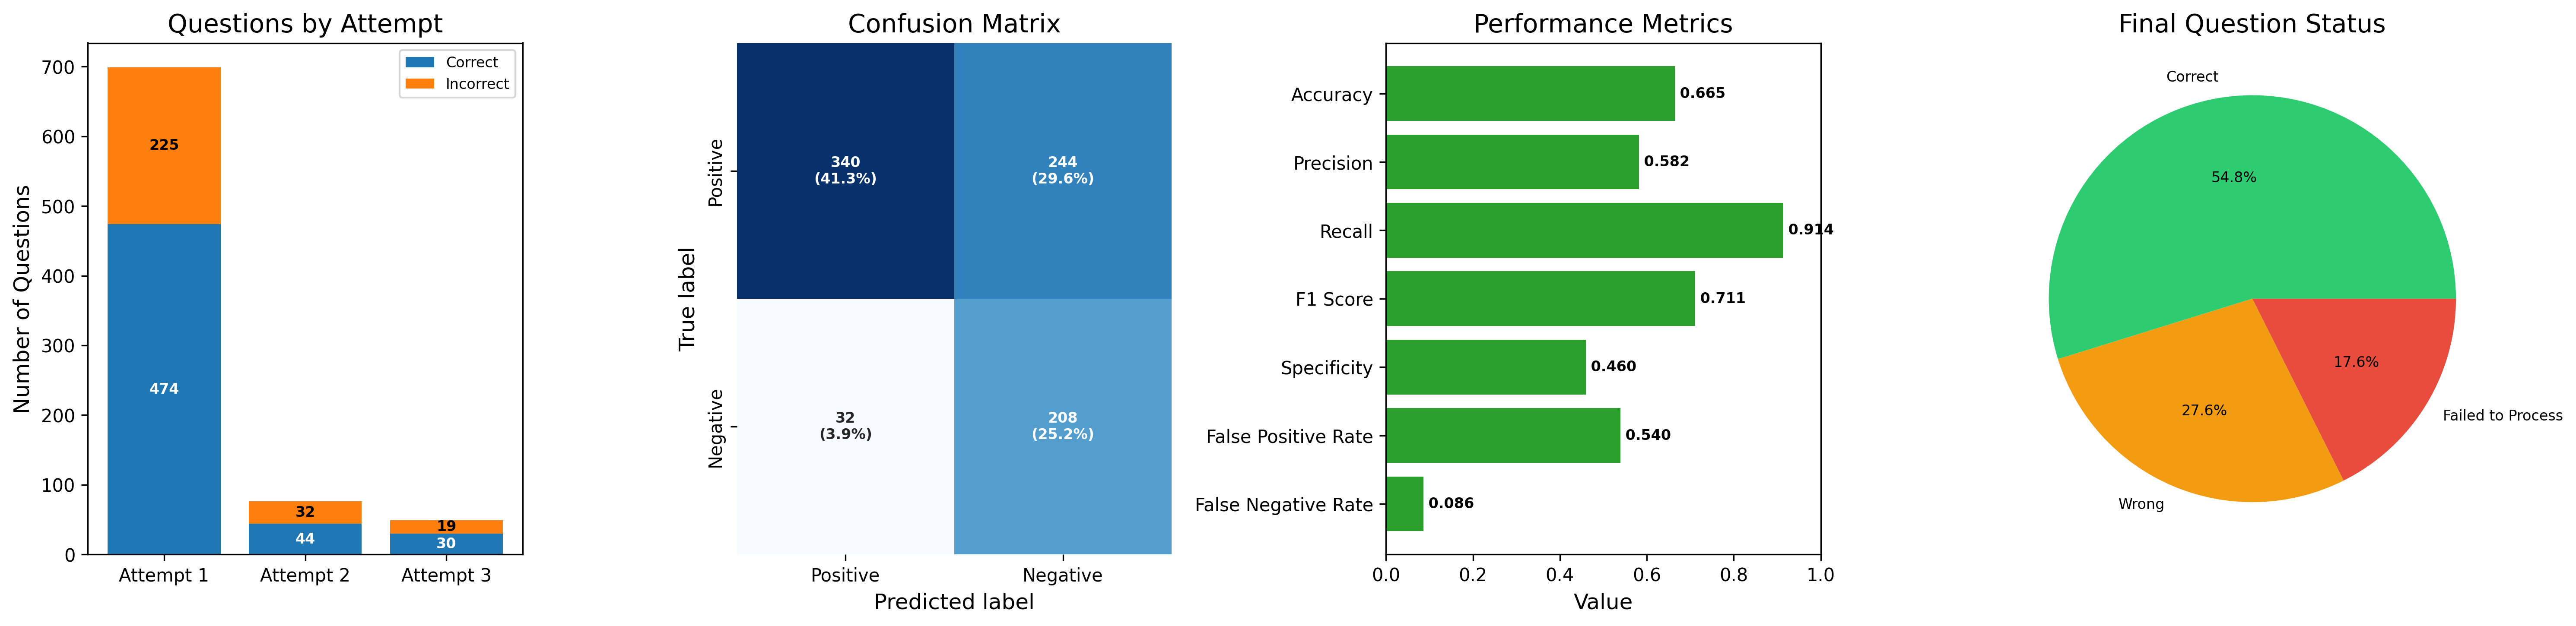
## Subplot 1: Questions by Attempt (Bar Chart)
### Labels and Axis Titles
- **Title**: "Questions by Attempt"
- **X-axis**: "Attempt 1", "Attempt 2", "Attempt 3"
- **Y-axis**: "Number of Questions" (range: 0–700)
- **Legend**:
- Blue: "Correct"
- Orange: "Incorrect"
- **Spatial Placement**: Top-right corner
### Data Points
- **Attempt 1**:
- Correct: 474 (blue)
- Incorrect: 225 (orange)
- **Attempt 2**:
- Correct: 44 (blue)
- Incorrect: 32 (orange)
- **Attempt 3**:
- Correct: 30 (blue)
- Incorrect: 19 (orange)
### Trends
- Correct answers decrease across attempts (474 → 44 → 30).
- Incorrect answers also decrease (225 → 32 → 19).
---
## Subplot 2: Confusion Matrix (Heatmap)
### Labels and Axis Titles
- **Title**: "Confusion Matrix"
- **X-axis**: "Positive", "Negative" (Predicted Labels)
- **Y-axis**: "Positive", "Negative" (True Labels)
- **Legend**: Not explicitly labeled (colors inferred from heatmap).
### Categories and Values
| True Label | Predicted Label | Value | Percentage |
|------------|-----------------|-------|------------|
| Positive | Positive | 340 | 41.3% |
| Positive | Negative | 244 | 29.6% |
| Negative | Positive | 32 | 3.9% |
| Negative | Negative | 208 | 25.2% |
---
## Subplot 3: Performance Metrics (Bar Chart)
### Labels and Axis Titles
- **Title**: "Performance Metrics"
- **X-axis**: "Value" (range: 0.0–1.0)
- **Y-axis**: Metric labels (vertical orientation)
- **Legend**: Green bars (no explicit legend, inferred from color).
### Metrics and Values
- **Accuracy**: 0.665
- **Precision**: 0.582
- **Recall**: 0.914
- **F1 Score**: 0.711
- **Specificity**: 0.460
- **False Positive Rate**: 0.540
- **False Negative Rate**: 0.086
### Trends
- **Recall** is the highest metric (0.914).
- **False Negative Rate** is the lowest (0.086).
---
## Subplot 4: Final Question Status (Pie Chart)
### Labels and Axis Titles
- **Title**: "Final Question Status"
- **Legend**:
- Green: "Correct"
- Orange: "Wrong"
- Red: "Failed to Process"
- **Spatial Placement**: Top-right corner
### Segments and Percentages
- **Correct**: 54.8% (green)
- **Wrong**: 27.6% (orange)
- **Failed to Process**: 17.6% (red)
---
## Cross-Referenced Observations
1. **Legend Consistency**:
- All subplots with legends (Subplots 1, 4) have colors matching their respective data points.
- Confusion matrix and performance metrics use inferred color coding (blue/orange for confusion matrix, green for performance metrics).
2. **Spatial Grounding**:
- Legends are consistently placed in the top-right corner for Subplots 1 and 4.
- Confusion matrix and performance metrics lack explicit legends but use standard color conventions.
3. **Trend Verification**:
- Subplot 1: Decreasing trend in both correct and incorrect answers across attempts.
- Subplot 2: High true positives (340) and false positives (244) dominate the matrix.
- Subplot 3: Recall (0.914) and F1 Score (0.711) outperform other metrics.
- Subplot 4: Majority of questions are marked "Correct" (54.8%).
---
## Final Notes
- All textual information, including axis labels, legends, and data points, has been extracted.
- No non-English text is present in the image.
- Data trends and relationships are explicitly described for clarity.