## Bar Chart: Percentage of Examples by Category
### Overview
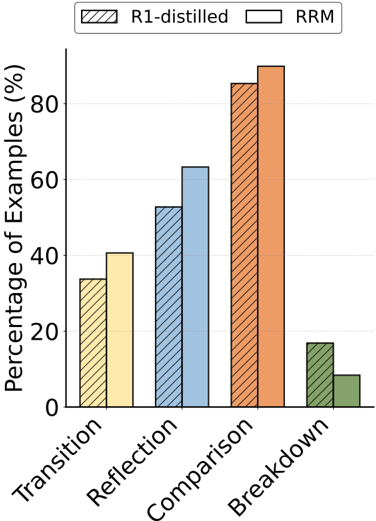
The image is a bar chart comparing the percentage of examples for different categories using two methods: "R1-distilled" and "RRM". The categories are "Transition", "Reflection", "Comparison", and "Breakdown". The chart displays the percentage of examples on the y-axis, ranging from 0% to 80%.
### Components/Axes
* **X-axis:** Categories: Transition, Reflection, Comparison, Breakdown.
* **Y-axis:** Percentage of Examples (%), ranging from 0 to 80, with gridlines at intervals of 20.
* **Legend:** Located at the top of the chart.
* R1-distilled: Represented by hatched bars.
* RRM: Represented by solid color bars.
### Detailed Analysis
* **Transition:**
* R1-distilled (hatched): Approximately 34%.
* RRM (yellow): Approximately 41%.
* **Reflection:**
* R1-distilled (hatched): Approximately 53%.
* RRM (light blue): Approximately 63%.
* **Comparison:**
* R1-distilled (hatched): Approximately 84%.
* RRM (orange): Approximately 89%.
* **Breakdown:**
* R1-distilled (hatched): Approximately 17%.
* RRM (green): Approximately 9%.
### Key Observations
* For all categories, the RRM method generally shows a higher percentage of examples compared to the R1-distilled method, except for the "Breakdown" category.
* The "Comparison" category has the highest percentage of examples for both methods.
* The "Breakdown" category has the lowest percentage of examples for both methods.
### Interpretation
The bar chart compares the performance of two methods, "R1-distilled" and "RRM", across four categories: "Transition", "Reflection", "Comparison", and "Breakdown". The data suggests that the RRM method generally performs better than the R1-distilled method, as it yields a higher percentage of examples in most categories. However, the R1-distilled method shows a higher percentage in the "Breakdown" category. The "Comparison" category stands out as having the highest percentage of examples for both methods, indicating that both methods are particularly effective in this area. Conversely, both methods struggle with the "Breakdown" category, as indicated by the low percentages.