\n
## Bar Chart: Rhetorical Relation Analysis
### Overview
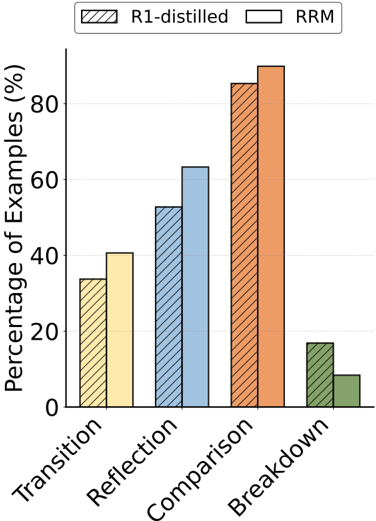
This is a bar chart comparing the percentage of examples identified as belonging to different rhetorical relations (Transition, Reflection, Comparison, Breakdown) using two different methods: R1-distilled and RRM. The y-axis represents the percentage of examples, and the x-axis represents the rhetorical relation categories.
### Components/Axes
* **X-axis Title:** Rhetorical Relation
* **Y-axis Title:** Percentage of Examples (%)
* **Legend:** Located in the top-left corner.
* R1-distilled (represented by a diagonally striped pattern)
* RRM (represented by a solid color)
* **Categories (X-axis):** Transition, Reflection, Comparison, Breakdown.
* **Y-axis Scale:** 0 to 100, with increments of 20.
### Detailed Analysis
The chart displays two bars for each rhetorical relation category, one for R1-distilled and one for RRM.
* **Transition:**
* R1-distilled: Approximately 34% (visually estimated).
* RRM: Approximately 38% (visually estimated).
* **Reflection:**
* R1-distilled: Approximately 42% (visually estimated).
* RRM: Approximately 40% (visually estimated).
* **Comparison:**
* R1-distilled: Approximately 86% (visually estimated).
* RRM: Approximately 89% (visually estimated).
* **Breakdown:**
* R1-distilled: Approximately 18% (visually estimated).
* RRM: Approximately 12% (visually estimated).
**Trends:**
* For Transition, RRM shows a slightly higher percentage than R1-distilled.
* For Reflection, R1-distilled shows a slightly higher percentage than RRM.
* For Comparison, both methods show high percentages, with RRM being slightly higher.
* For Breakdown, R1-distilled shows a significantly higher percentage than RRM.
### Key Observations
* The largest difference between the two methods is observed for the "Breakdown" category, where R1-distilled identifies a much higher percentage of examples than RRM.
* Both methods perform similarly well in identifying "Comparison" examples, with both exceeding 85%.
* The percentages for "Transition" and "Reflection" are relatively similar between the two methods.
### Interpretation
The data suggests that the two methods, R1-distilled and RRM, have different sensitivities in identifying rhetorical relations. R1-distilled appears to be more sensitive to "Breakdown" relations, while RRM performs slightly better on "Transition" and "Comparison". The high agreement on "Comparison" suggests that this relation is relatively easy to identify for both methods. The discrepancy in "Breakdown" could indicate that RRM may require more explicit cues to identify this relation, or that R1-distilled is more prone to false positives in this category. Further investigation into the specific examples classified as "Breakdown" by each method would be necessary to understand the underlying reasons for this difference. The chart demonstrates a comparison of two methods for rhetorical relation classification, highlighting their strengths and weaknesses in identifying different types of relations.