## Line Graph: Latency vs. Throughput Comparison
### Overview
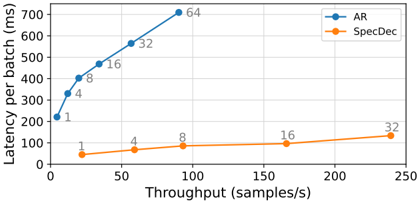
The image is a line graph comparing the latency (in milliseconds) and throughput (in samples per second) of two methods: **AR** (blue line) and **SpecDec** (orange line). The x-axis represents throughput, and the y-axis represents latency. Data points are labeled with numerical values, likely indicating batch sizes or configuration parameters.
### Components/Axes
- **X-axis (Throughput)**: Labeled "Throughput (samples/s)", ranging from 0 to 250 samples/s.
- **Y-axis (Latency)**: Labeled "Latency per batch (ms)", ranging from 0 to 700 ms.
- **Legend**: Located in the top-right corner, with:
- **Blue line (AR)**: Marked with "AR" and circular data points.
- **Orange line (SpecDec)**: Marked with "SpecDec" and square data points.
### Detailed Analysis
#### AR (Blue Line)
- **Data Points**:
- (1, 220 ms)
- (4, 320 ms)
- (8, 400 ms)
- (16, 480 ms)
- (32, 560 ms)
- (64, 700 ms)
- **Trend**: The line slopes steeply upward, indicating latency increases rapidly with higher throughput.
#### SpecDec (Orange Line)
- **Data Points**:
- (1, 40 ms)
- (4, 60 ms)
- (8, 80 ms)
- (16, 100 ms)
- (32, 120 ms)
- **Trend**: The line slopes gently upward, showing a much slower increase in latency with throughput.
### Key Observations
1. **Latency-Throughput Tradeoff**:
- AR achieves higher throughput (up to 64 samples/s) but at significantly higher latency (700 ms).
- SpecDec maintains lower latency (≤120 ms) but with lower throughput (≤32 samples/s).
2. **Batch Size Correlation**:
- Data point labels (e.g., 1, 4, 8, 16, 32, 64) likely represent batch sizes, with larger batches increasing throughput for AR but exacerbating latency.
3. **Scalability**:
- AR scales better for high-throughput tasks, while SpecDec is optimized for low-latency, low-throughput scenarios.
### Interpretation
The graph highlights a clear tradeoff between latency and throughput between the two methods. **AR** prioritizes throughput at the cost of higher latency, making it suitable for applications requiring high data processing rates (e.g., real-time analytics). **SpecDec**, with its lower latency, is better suited for latency-sensitive tasks (e.g., real-time control systems). The labeled batch sizes suggest the methods were tested under varying computational loads, with AR’s performance degrading more sharply under increased batch sizes. This could reflect differences in algorithmic efficiency or hardware utilization between the two approaches.