\n
## Diagram: Reasoning Step Illustration
### Overview
The image depicts a diagram illustrating a series of steps in a reasoning process, likely within a decision tree or similar structure. It shows a transformation of a tree-like structure from a state on the left to a state on the right, with an arrow indicating the flow of change. The diagram uses nodes with numerical values and check/cross symbols to represent states and outcomes.
### Components/Axes
The diagram consists of two main tree structures, labeled "N0", "N1", and "N2". There are numerical values associated with each node (0.5, 0.75, 1, 0.3). Leaf nodes are marked with either a green checkmark (✓) or a red cross (✗). A curved blue arrow indicates the direction of change. Below the diagram are three steps describing the transformation.
### Detailed Analysis or Content Details
**Left Side (Initial State):**
* **N0:** Value 0.75. Has two child nodes.
* **N1:** Value 0.73. Has two child nodes.
* **N2:** Value 1. Has two child nodes.
* The connection between N1 and N2 is a direct line.
* The leaf nodes connected to N1's children are: ✓, ✓, ✗, ✓.
* The leaf nodes connected to N2's children are: ✓, ✓, ✗, ✓.
**Right Side (Transformed State):**
* **N0:** Value 0.75. Has two child nodes.
* **N1:** Value 1. Has two child nodes.
* **N2:** Value 0.3. Has two child nodes.
* The direct connection between N1 and N2 is removed.
* N2 now points to N0.
* The leaf nodes connected to N1's children are: ✗, ✓, ✓, ✓.
* The leaf nodes connected to N2's children are: ✓, ✓, ✗, ✓.
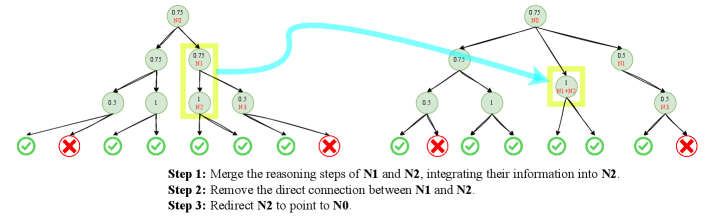
**Steps:**
1. "Step 1: Merge the reasoning steps of N1 and N2, integrating their information into N2."
2. "Step 2: Remove the direct connection between N1 and N2."
3. "Step 3: Redirect N2 to point to N0."
### Key Observations
* The values associated with N1 and N2 change during the transformation. N1 increases from 0.73 to 1, and N2 decreases from 1 to 0.3.
* The leaf node outcomes also change between the initial and transformed states.
* The transformation appears to consolidate information from N1 and N2 into N2, then re-routes N2's connection.
* The highlighted yellow boxes around N1 and N2 on the left and N1 on the right emphasize the nodes involved in the transformation.
### Interpretation
This diagram illustrates a process of information consolidation and re-evaluation within a reasoning system. The initial state shows two separate reasoning paths (N1 and N2) branching from a common root (N0). The transformation steps suggest that the system is merging the information from these two paths, potentially resolving conflicting outcomes. The change in values (0.73 to 1 for N1, 1 to 0.3 for N2) could represent a weighting or confidence adjustment based on the merged information. The removal of the direct connection between N1 and N2 and the redirection of N2 to N0 indicate a restructuring of the reasoning flow. The change in leaf node outcomes (checkmarks and crosses) suggests that the consolidation process has altered the final conclusions reached by the system.
The diagram is a visual representation of a logical operation, likely used in artificial intelligence, machine learning, or decision-making systems. It demonstrates how a system can refine its reasoning by integrating information from multiple sources and adjusting its internal structure accordingly. The steps are a clear description of the process. The diagram is not presenting data in the traditional sense, but rather illustrating a *process* of data manipulation and reasoning.