## Flowchart Diagram: Node Integration and Connection Adjustment Process
### Overview
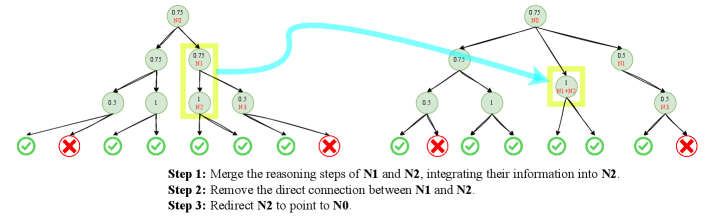
The diagram illustrates a three-step process for integrating and adjusting connections between nodes in a decision-making or reasoning framework. It features two primary node trees (left and right), a blue directional arrow, and annotated steps. Nodes are labeled with identifiers (e.g., N1, N2, N0) and confidence scores (e.g., 0.75, 0.5), while green checkmarks (✓) and red X marks indicate success/failure states.
---
### Components/Axes
1. **Nodes**:
- **Left Tree**: Contains nodes labeled N1 (0.75), N2 (0.75), N3 (0.5), and N0 (0.75).
- **Right Tree**: Contains nodes labeled N1 (0.75), N2 (0.75), N3 (0.5), and N0 (0.75).
- **Merged Node**: A highlighted node labeled "N1+N2" (0.75) in the left tree.
2. **Arrows**:
- Black arrows represent standard connections between nodes.
- A blue arrow connects the merged "N1+N2" node to the right tree's N2 node.
3. **Symbols**:
- Green checkmarks (✓) denote successful steps.
- Red X marks denote failed steps.
4. **Steps**:
- **Step 1**: Merge reasoning steps of N1 and N2 into N2.
- **Step 2**: Remove direct connection between N1 and N2.
- **Step 3**: Redirect N2 to point to N0.
---
### Detailed Analysis
1. **Node Labels and Confidence Scores**:
- Nodes N1, N2, and N0 consistently show a confidence score of 0.75, while N3 has 0.5. This suggests N1, N2, and N0 are high-confidence nodes, whereas N3 is less reliable.
- The merged "N1+N2" node retains the 0.75 confidence score, indicating no loss of certainty during integration.
2. **Connections**:
- The blue arrow initially links the merged "N1+N2" node to the right tree's N2 node, suggesting a dependency or flow of information.
- After Step 2, the direct connection between N1 and N2 is removed, breaking their original linkage.
- Step 3 introduces a new connection from N2 to N0, altering the flow of information.
3. **Success/Failure Indicators**:
- Checkmarks (✓) appear on most nodes, except for N3 in the left tree and N3 in the right tree, which are marked with Xs. This implies N3 is consistently unreliable across steps.
---
### Key Observations
1. **Consistent Confidence Scores**: N1, N2, and N0 maintain 0.75 confidence throughout, while N3 remains at 0.5, indicating stable reliability for high-confidence nodes.
2. **Process Flow**:
- Step 1 merges N1 and N2 into N2, preserving their combined confidence.
- Step 2 severs the direct N1-N2 link, simplifying the network.
- Step 3 redirects N2 to N0, creating a new dependency path.
3. **Failure Patterns**: N3 is marked as failed (X) in both trees, suggesting it is excluded from the final workflow.
---
### Interpretation
The diagram represents a structured workflow for optimizing node interactions in a decision-making system. By merging high-confidence nodes (N1 and N2) and redirecting connections, the process aims to streamline information flow while eliminating redundant or unreliable paths (e.g., N3). The preservation of confidence scores during merging suggests the integration does not dilute reliability. The final redirection of N2 to N0 implies a prioritization of N0 as a critical endpoint or decision node. The use of checkmarks and Xs highlights the importance of validating each step to ensure system integrity.