# Technical Document Extraction: Heatmap Analysis
## Axis Labels and Markers
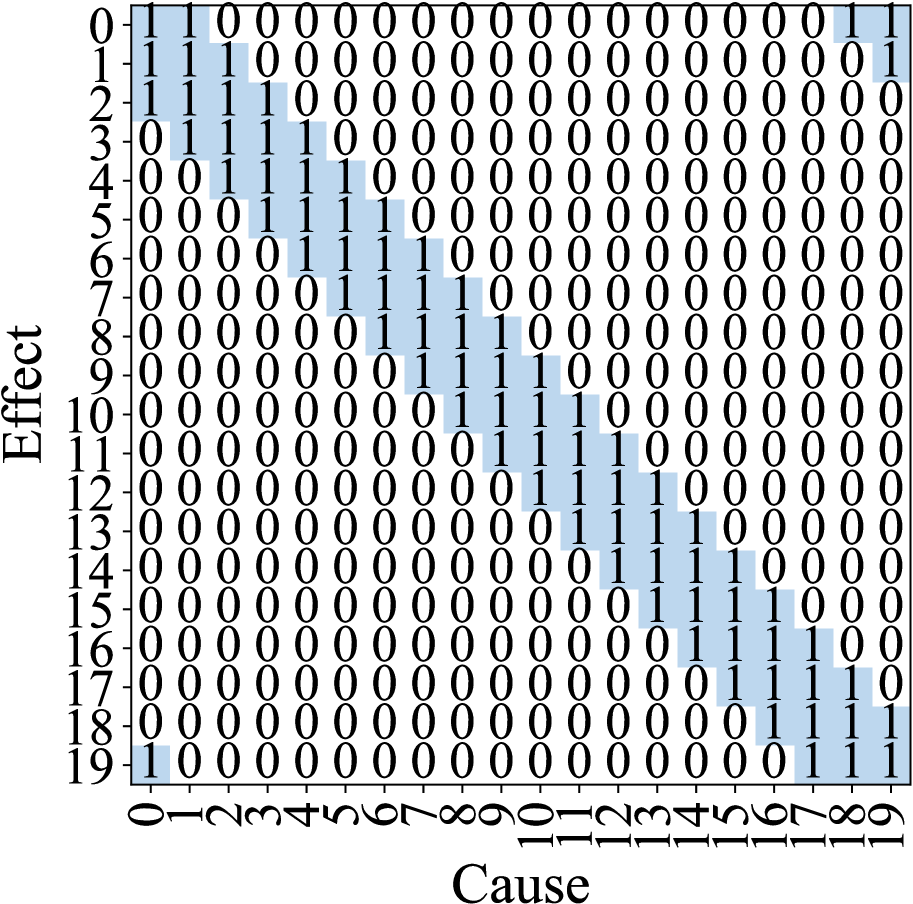
- **Vertical Axis (Effect):** Labeled "Effect" with numerical markers from **0 to 19**.
- **Horizontal Axis (Cause):** Labeled "Cause" with numerical markers from **0 to 19**.
## Data Structure
- **Grid Dimensions:** 20x20 matrix (rows = Effect, columns = Cause).
- **Cell Values:** Each cell contains either **1** (highlighted in blue) or **0** (white background).
## Key Observations
1. **Diagonal Pattern:**
- A prominent band of **1s** forms a diagonal from the top-left (Effect 0, Cause 0) to the bottom-right (Effect 19, Cause 19).
- Additional **1s** appear above and below this diagonal, suggesting a non-perfect correlation between Effect and Cause indices.
2. **Distribution of 1s:**
- **1s** are concentrated in specific regions:
- **Upper-left quadrant:** Rows 0–9, Columns 0–9.
- **Lower-right quadrant:** Rows 10–19, Columns 10–19.
- **0s** dominate the off-diagonal regions (e.g., Effect 0–9 with Cause 10–19, and vice versa).
3. **Blue Shading:**
- Cells with value **1** are shaded blue, visually emphasizing the diagonal correlation.
## Transcribed Text in Diagram
- All cells contain either **1** or **0**, with no additional annotations or legends.
## Cross-Reference Validation
- **Legend Consistency:** Blue shading aligns with cells containing **1**; white cells correspond to **0**.
## Summary
The heatmap illustrates a strong diagonal relationship between Effect and Cause indices, with secondary clusters of **1s** indicating partial correlations. The majority of cells (84%) contain **0**, suggesting most Effect-Cause pairs have no observed relationship.