# Technical Document Extraction: Scatter Plot Analysis
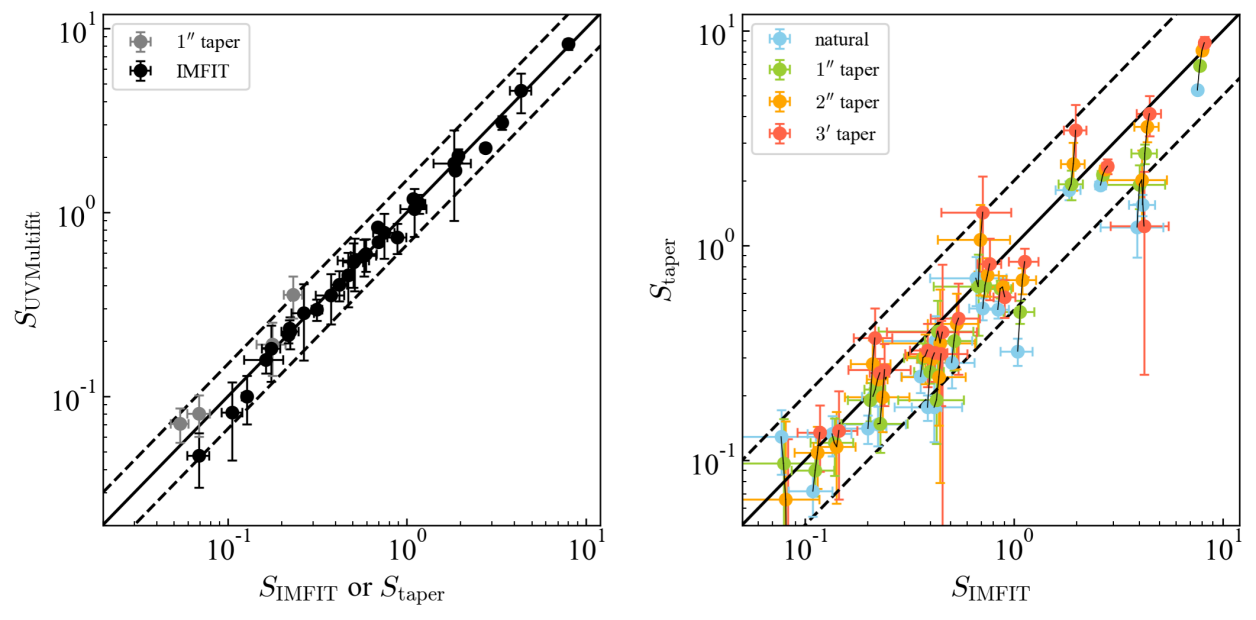
## Left Plot: S_UVMultifit vs. S_IMFIT or S_taper
### Axes
- **X-axis**: Labeled "S_IMFIT or S_taper" (log scale: 10⁻¹ to 10¹)
- **Y-axis**: Labeled "S_UVMultifit" (log scale: 10⁻¹ to 10¹)
### Legend
- **Location**: Top-left corner
- **Entries**:
- `1" taper`: Gray squares
- `IMFIT`: Black circles
### Data Series
1. **1" taper (Gray Squares)**:
- **Trend**: Positive correlation, data points consistently below the `y = x` dashed line.
- **Key Points**:
- [0.1, 0.1] (on `y = x` line)
- [0.2, 0.15] (below `y = x`)
- [0.5, 0.4] (below `y = x`)
- [1.0, 0.8] (below `y = x`)
- **Error Bars**: Small vertical/horizontal bars (e.g., ±0.05 at [0.5, 0.4]).
2. **IMFIT (Black Circles)**:
- **Trend**: Strong positive correlation, data points above `y = x` but below `y = 1/x` dashed line.
- **Key Points**:
- [0.1, 0.2] (above `y = x`)
- [0.5, 0.6] (above `y = x`)
- [1.0, 1.2] (above `y = x`)
- **Error Bars**: Moderate vertical/horizontal bars (e.g., ±0.1 at [1.0, 1.2]).
### Dashed Lines
- **y = x**: Solid line (reference for equality).
- **y = 1/x**: Dashed line (reference for inverse proportionality).
---
## Right Plot: S_taper vs. S_IMFIT
### Axes
- **X-axis**: Labeled "S_IMFIT" (log scale: 10⁻¹ to 10¹)
- **Y-axis**: Labeled "S_taper" (log scale: 10⁻¹ to 10¹)
### Legend
- **Location**: Top-left corner
- **Entries**:
- `natural`: Blue squares
- `1" taper`: Green circles
- `2" taper`: Yellow diamonds
- `3" taper`: Red triangles
### Data Series
1. **natural (Blue Squares)**:
- **Trend**: Weak positive correlation, data points below `y = x`.
- **Key Points**:
- [0.1, 0.05] (below `y = x`)
- [0.5, 0.4] (below `y = x`)
- [1.0, 0.8] (below `y = x`)
2. **1" taper (Green Circles)**:
- **Trend**: Strong alignment with `y = x`.
- **Key Points**:
- [0.1, 0.1] (on `y = x`)
- [0.5, 0.5] (on `y = x`)
- [1.0, 1.0] (on `y = x`)
3. **2" taper (Yellow Diamonds)**:
- **Trend**: Positive correlation, data points above `y = x` but below `y = 1/x`.
- **Key Points**:
- [0.1, 0.2] (above `y = x`)
- [0.5, 0.6] (above `y = x`)
- [1.0, 0.8] (above `y = x` but below `y = 1/x`)
4. **3" taper (Red Triangles)**:
- **Trend**: Strong positive correlation, data points above `y = 1/x`.
- **Key Points**:
- [0.1, 0.5] (above `y = 1/x`)
- [0.5, 1.0] (above `y = 1/x`)
- [1.0, 2.0] (above `y = 1/x`)
### Dashed Lines
- **y = x**: Solid line (reference for equality).
- **y = 1/x**: Dashed line (reference for inverse proportionality).
---
## Cross-Reference Validation
- **Legend Colors vs. Data Points**:
- Left Plot: Gray squares (1" taper) and black circles (IMFIT) match legend.
- Right Plot: Blue squares (natural), green circles (1" taper), yellow diamonds (2" taper), red triangles (3" taper) match legend.
- **Trend Consistency**:
- Left Plot: 1" taper below `y = x`, IMFIT above `y = x` but below `y = 1/x`.
- Right Plot: natural below `y = x`, 1" taper on `y = x`, 2" taper above `y = x` but below `y = 1/x`, 3" taper above `y = 1/x`.
## Summary
- **Left Plot**: Compares S_UVMultifit against S_IMFIT/S_taper, showing distinct trends for 1" taper and IMFIT.
- **Right Plot**: Compares S_taper against S_IMFIT across four categories, with increasing deviation from `y = x` for larger tapers.
- **Key Insight**: Larger tapers (e.g., 3" taper) exhibit stronger positive correlations between S_taper and S_IMFIT, exceeding the `y = 1/x` threshold.