# TabArena Benchmark: Model Performance vs. Efficiency
## Chart Description
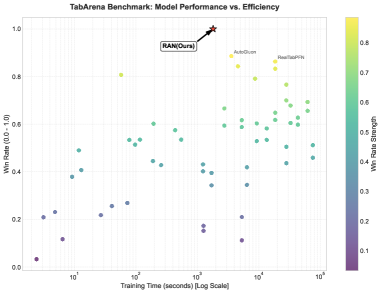
This scatter plot visualizes the relationship between **training time** and **win rate** for various models on the TabArena benchmark. The x-axis represents training time (log scale), and the y-axis represents win rate (0.0–1.0). Data points are color-coded by win rate strength, with a gradient from purple (low) to yellow (high).
---
### Key Components
1. **Title**:
- "TabArena Benchmark: Model Performance vs. Efficiency"
2. **Axes**:
- **X-axis**: "Training Time (seconds) [Log Scale]"
- Range: \(10^1\) to \(10^5\) seconds
- **Y-axis**: "Win Rate (0.0 - 1.0)"
- Range: 0.0 to 1.0
3. **Legend**:
- Located on the right side of the plot.
- Color gradient:
- Purple → Yellow (Win Rate Strength: 0.1 → 0.8)
4. **Data Points**:
- Scattered across the plot, with varying colors indicating win rate strength.
- Notable labels:
- **AutoGluon**: Clustered near \(10^4\) seconds, win rate ~0.85.
- **RealTabPFN**: Near \(10^4\) seconds, win rate ~0.8.
- **RAN(Ours)**: Highlighted with a red star at \(10^5\) seconds, win rate ~0.95.
---
### Trends and Observations
1. **Performance vs. Efficiency**:
- Models with higher training times (e.g., \(10^4\)–\(10^5\) seconds) generally achieve higher win rates (0.6–0.9).
- Lower training times (\(10^1\)–\(10^3\) seconds) correlate with lower win rates (0.0–0.4).
2. **RAN(Ours) Dominance**:
- The red star labeled "RAN(Ours)" is positioned at the top-right corner (\(10^5\) seconds, ~0.95 win rate), indicating superior performance and efficiency.
3. **Cluster Analysis**:
- **AutoGluon** and **RealTabPFN** cluster near \(10^4\) seconds, with win rates ~0.8–0.85.
- Lower-performing models (e.g., purple points) are concentrated in the bottom-left quadrant.
---
### Spatial Grounding and Verification
- **Legend Position**: Right side of the plot, adjacent to the color bar.
- **Color Consistency**:
- Yellow data points (highest win rate) align with the legend’s top range (0.8).
- Purple data points (lowest win rate) match the legend’s bottom range (0.1).
- **Trend Verification**:
- Data series slope upward from left (low training time, low win rate) to right (high training time, high win rate).
---
### Conclusion
The chart demonstrates a clear trade-off between training time and win rate, with **RAN(Ours)** achieving the highest efficiency (lowest training time for peak performance). AutoGluon and RealTabPFN represent strong but less optimal alternatives.