## 3D Scatter Plots: Dimensionality Reduction Visualization
### Overview
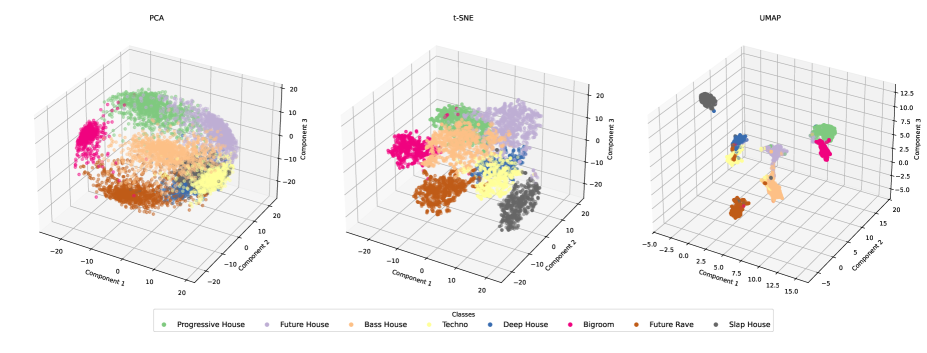
The image contains three 3D scatter plots comparing the performance of three dimensionality reduction techniques (PCA, t-SNE, UMAP) on a dataset of music genre classifications. Each plot visualizes data points distributed across three principal components, with color-coded clusters representing distinct music genres.
### Components/Axes
1. **Plots**:
- **Left**: PCA (Principal Component Analysis)
- **Center**: t-SNE (t-Distributed Stochastic Neighbor Embedding)
- **Right**: UMAP (Uniform Manifold Approximation and Projection)
2. **Axes**:
- All plots share the same axis labels:
- **X-axis**: Component 1
- **Y-axis**: Component 2
- **Z-axis**: Component 3
- Axis ranges vary slightly:
- PCA/t-SNE: -20 to +20
- UMAP: -5 to +15 (X), -5 to +15 (Y), -2.5 to +12.5 (Z)
3. **Legend**:
- Located at the bottom center of the image
- Color-coded classes (10 genres):
- Progressive House (green)
- Future House (purple)
- Bass House (orange)
- Techno (yellow)
- Deep House (blue)
- Bigroom (pink)
- Future Rave (brown)
- Slap House (gray)
- No explicit numerical values or uncertainty ranges provided in the legend.
### Detailed Analysis
1. **PCA Plot**:
- Data points are widely dispersed across all three components.
- Progressive House (green) and Future House (purple) form the largest clusters, occupying the upper-left quadrant.
- Slap House (gray) and Bigroom (pink) appear as smaller, isolated clusters in the lower-right quadrant.
2. **t-SNE Plot**:
- Points show moderate clustering with some overlap between genres.
- Techno (yellow) and Deep House (blue) form a dense cluster near the center.
- Future Rave (brown) and Bass House (orange) are positioned in the lower-left quadrant.
3. **UMAP Plot**:
- Tightest clustering observed, with distinct separation between genres.
- Progressive House (green) dominates the upper-right quadrant.
- Slap House (gray) forms a compact cluster in the lower-left corner.
- UMAP's Z-axis (Component 3) shows the most pronounced separation between classes.
### Key Observations
1. **Cluster Density**:
- UMAP demonstrates the highest cluster separation (e.g., Slap House in lower-left, Progressive House in upper-right).
- PCA shows the least distinct clustering, with significant overlap between genres.
2. **Axis Utilization**:
- In PCA, Component 1 and 2 dominate the spread, while Component 3 has minimal variation.
- t-SNE utilizes all three components more evenly.
- UMAP's Z-axis (Component 3) shows the greatest discriminative power.
3. **Color Consistency**:
- All plots maintain identical color coding per legend (e.g., pink = Bigroom in all plots).
- No discrepancies observed between legend labels and data point colors.
### Interpretation
The visualization demonstrates how different dimensionality reduction techniques preserve data structure:
1. **PCA** (linear method) struggles to capture non-linear relationships, resulting in dispersed clusters.
2. **t-SNE** balances global and local structure preservation, showing moderate clustering with some overlap.
3. **UMAP** excels at maintaining both global topology and local relationships, producing the most distinct genre separation.
Notable patterns:
- Progressive House consistently appears in the upper-left quadrant across all methods, suggesting it has dominant features in the first two principal components.
- Slap House (gray) shows the most consistent positioning in the lower-left quadrant, indicating shared characteristics across reduction methods.
- The Z-axis (Component 3) becomes increasingly important for discrimination in t-SNE and UMAP, highlighting its role in capturing subtle genre distinctions.
This analysis suggests UMAP may be the most effective technique for this dataset, while PCA's linear limitations become apparent in the visualization.