## Image Comparison: 2D-GS Methods
### Overview
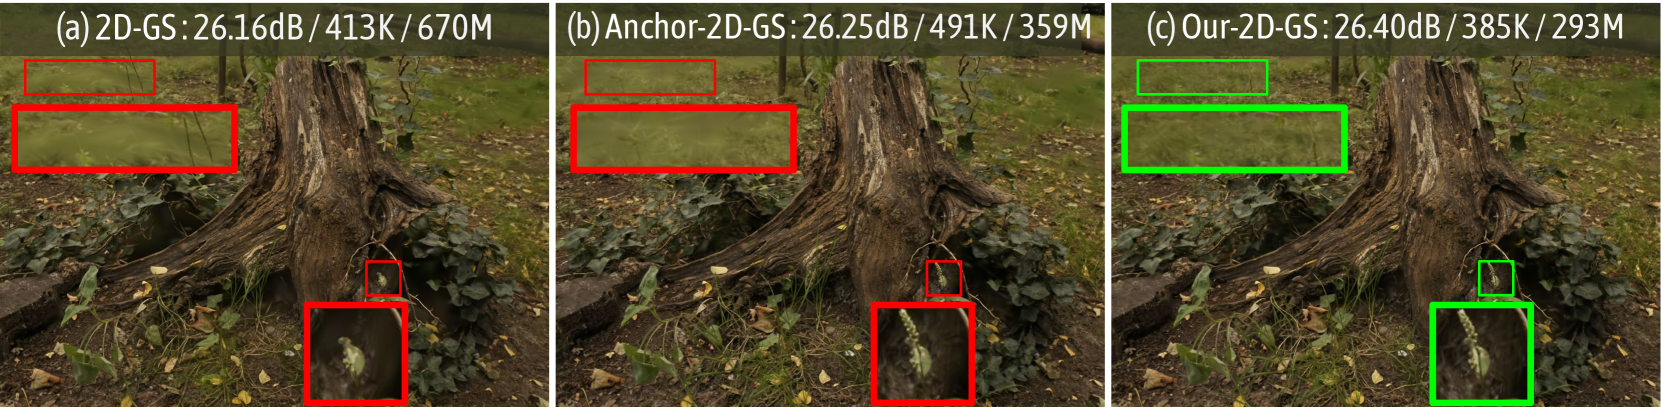
The image presents a side-by-side comparison of three different 2D-GS (Gaussian Splatting) methods applied to the same scene. The scene appears to be a forest floor with a tree stump. Each method's result is displayed with a title indicating the method used, a dB (decibel) value, a K value, and an M value. The images are annotated with rectangular regions highlighting specific areas, with red rectangles for the first two methods and green rectangles for the third.
### Components/Axes
* **Titles:**
* (a) 2D-GS: 26.16dB/413K/670M
* (b) Anchor-2D-GS: 26.25dB/491K/359M
* (c) Our-2D-GS: 26.40dB/385K/293M
* **Annotations:** Red and green rectangles highlighting regions in each image.
### Detailed Analysis or Content Details
* **(a) 2D-GS:**
* Title: 2D-GS: 26.16dB/413K/670M
* Two red rectangles are present in the upper portion of the image, highlighting areas of the background.
* Two red rectangles are present near the base of the tree stump, highlighting details.
* **(b) Anchor-2D-GS:**
* Title: Anchor-2D-GS: 26.25dB/491K/359M
* Two red rectangles are present in the upper portion of the image, highlighting areas of the background.
* Two red rectangles are present near the base of the tree stump, highlighting details.
* **(c) Our-2D-GS:**
* Title: Our-2D-GS: 26.40dB/385K/293M
* Two green rectangles are present in the upper portion of the image, highlighting areas of the background.
* Two green rectangles are present near the base of the tree stump, highlighting details.
### Key Observations
* The dB values increase from (a) to (c): 26.16dB, 26.25dB, 26.40dB.
* The K values decrease from (a) to (c): 413K, 491K, 385K.
* The M values decrease significantly from (a) to (c): 670M, 359M, 293M.
* The highlighted regions appear to focus on areas where the differences between the methods are most apparent.
### Interpretation
The image compares the performance of three 2D Gaussian Splatting methods. The dB values likely represent a measure of quality or signal-to-noise ratio, with higher values indicating better performance. The K and M values likely represent the size or complexity of the model, with lower values indicating a more efficient model.
The data suggests that "Our-2D-GS" (c) achieves the highest dB value (26.40dB) while also having the lowest M value (293M), indicating a potentially superior method in terms of both quality and efficiency. The highlighted regions likely draw attention to areas where the visual differences between the methods are most noticeable, possibly in terms of detail, clarity, or artifact reduction.