\n
## Image Analysis: Visual Comparison of Image Enhancement Techniques
### Overview
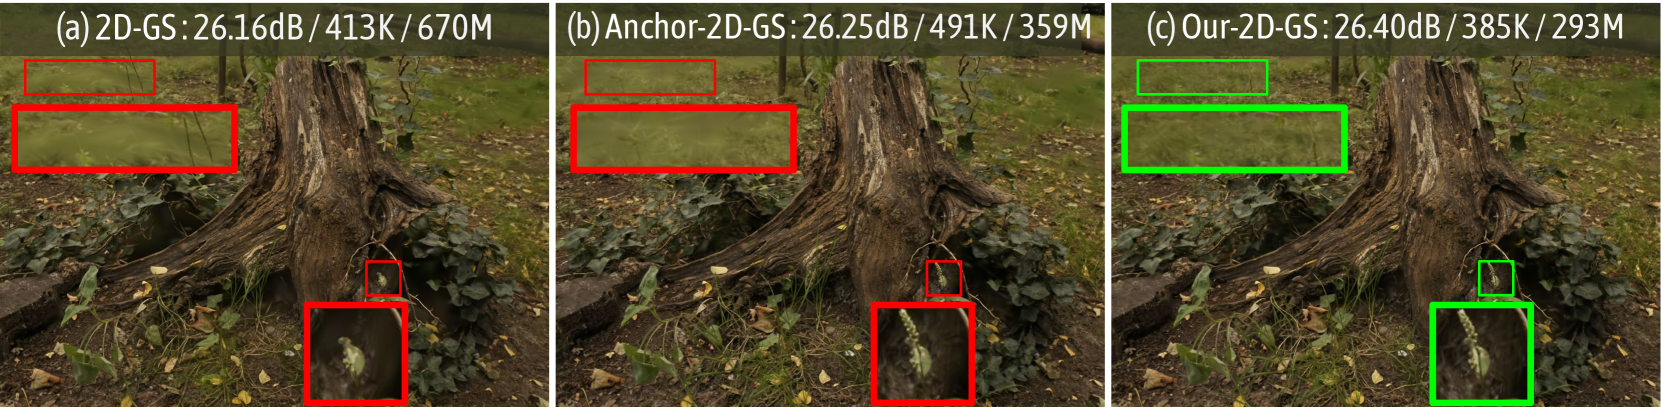
The image presents a side-by-side comparison of three different image enhancement techniques applied to the same source image of a tree stump with foliage. Each sub-image (a, b, c) represents the result of a different technique, labeled with performance metrics. Red bounding boxes highlight a specific region of interest in sub-images (a) and (b), while green bounding boxes are used in sub-image (c).
### Components/Axes
The image does not contain traditional axes or charts. Instead, it presents three visually comparable images, each labeled with the following information positioned at the top:
* **Technique Name:** 2D-GS, Anchor-2D-GS, and Our-2D-GS.
* **dB Value:** A numerical value representing signal-to-noise ratio or similar metric in decibels (dB).
* **Memory Usage:** A value representing memory usage in kilobytes (K) and megabytes (M).
### Detailed Analysis or Content Details
Let's analyze each sub-image individually:
**(a) 2D-GS:**
* dB Value: 26.16dB
* Memory Usage: 413K / 670M
* A red bounding box is drawn around the upper-left foliage.
* A red bounding box is drawn around the lower-center foliage.
**(b) Anchor-2D-GS:**
* dB Value: 26.25dB
* Memory Usage: 491K / 359M
* A red bounding box is drawn around the upper-left foliage, similar to (a).
* A red bounding box is drawn around the lower-center foliage, similar to (a).
**(c) Our-2D-GS:**
* dB Value: 26.40dB
* Memory Usage: 385K / 293M
* A green bounding box is drawn around the upper-left foliage.
* A green bounding box is drawn around the lower-center foliage.
### Key Observations
* **dB Value Trend:** The dB value increases sequentially from (a) to (c): 26.16dB, 26.25dB, 26.40dB. This suggests that the "Our-2D-GS" technique achieves the highest signal-to-noise ratio or similar metric.
* **Memory Usage:** Memory usage varies between the techniques. "Anchor-2D-GS" uses the most memory (491K / 359M), while "Our-2D-GS" uses the least (385K / 293M). "2D-GS" falls in between (413K / 670M).
* **Bounding Box Color:** The bounding box color changes from red in (a) and (b) to green in (c). This visually highlights the region of interest and potentially indicates a difference in how each technique processes that area.
* **Visual Quality:** Visually, the foliage within the green bounding box in (c) appears slightly more defined and clearer compared to the red bounding boxes in (a) and (b).
### Interpretation
The image demonstrates a comparison of three image enhancement techniques, likely for object detection or image segmentation. The "Our-2D-GS" technique appears to be the most effective, achieving the highest dB value (indicating better signal quality) while using the least amount of memory. The change in bounding box color from red to green in (c) suggests that the "Our-2D-GS" technique may be better at highlighting or segmenting the foliage within the specified regions.
The dB values are relatively close, suggesting that all three techniques perform similarly, but "Our-2D-GS" offers a slight improvement in signal quality with a memory efficiency benefit. The memory usage values are presented in a mixed format (K and M), which might indicate different units for different memory components (e.g., K for temporary buffers, M for overall model size).
The image is a qualitative and quantitative comparison, aiming to showcase the advantages of the "Our-2D-GS" technique over the other two. The choice of a tree stump with foliage as the test image suggests that the techniques are intended for use in natural scene understanding or similar applications.