## Photographs: Comparative Analysis of 2D-GS Methods
### Overview
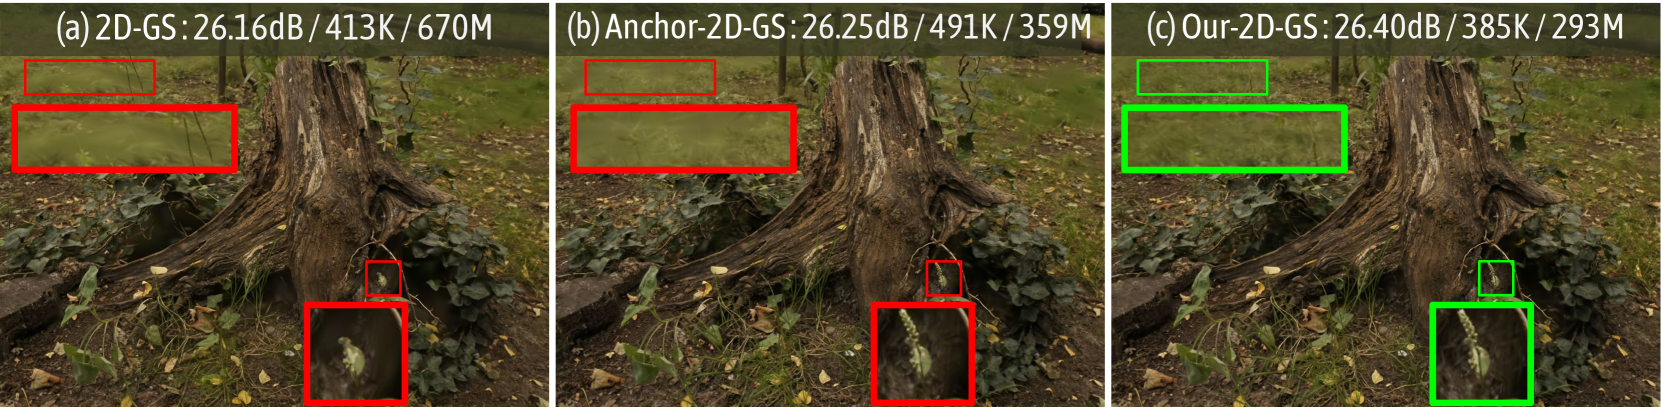
The image presents three side-by-side photographs of a forest scene centered on a large tree trunk with exposed roots, surrounded by greenery and fallen leaves. Each photograph is annotated with technical metrics and highlighted regions, suggesting a comparison of computational methods or algorithms.
### Components/Axes
- **Labels**:
- (a) 2D-GS: 26.16dB / 413K / 670M
- (b) Anchor-2D-GS: 26.25dB / 491K / 359M
- (c) Our-2D-GS: 26.40dB / 385K / 293M
- **Annotations**:
- Red boxes (a and b) highlight specific areas of the tree trunk and ground.
- Green boxes (c) highlight similar regions in the third image.
- **Metrics**:
- dB (likely signal-to-noise ratio or quality metric)
- K (thousands of operations or parameters)
- M (millions of operations or parameters)
### Detailed Analysis
1. **Image (a) - 2D-GS**:
- dB: 26.16
- K: 413
- M: 670
- Red boxes emphasize the tree trunk's texture and ground vegetation.
2. **Image (b) - Anchor-2D-GS**:
- dB: 26.25
- K: 491
- M: 359
- Red boxes focus on the same regions as (a), with slightly higher dB but lower M.
3. **Image (c) - Our-2D-GS**:
- dB: 26.40
- K: 385
- M: 293
- Green boxes highlight the same areas, with the highest dB and lowest K/M values.
### Key Observations
- **dB Trends**:
- "Our-2D-GS" achieves the highest dB (26.40), suggesting superior performance in the measured metric (e.g., image quality or compression efficiency).
- **Resource Usage (K/M)**:
- "Our-2D-GS" uses fewer resources (K: 385, M: 293) compared to the other methods, indicating better efficiency.
- **Annotations**:
- Highlighted regions (red/green boxes) appear consistent across images, implying direct comparison of the same features.
### Interpretation
The data suggests that "Our-2D-GS" outperforms the baseline methods in both quality (higher dB) and efficiency (lower K/M). The consistent annotations across images confirm that the comparison is focused on identical features, likely the tree trunk and ground details. The reduction in computational resources (K/M) while maintaining or improving dB values implies an optimized algorithm or model architecture. This could indicate advancements in compression, feature extraction, or processing efficiency for 2D-GS applications.