## Diagram: Batch Arrangement
### Overview
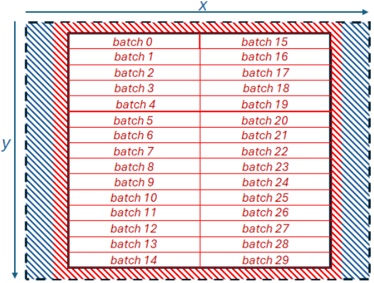
The image is a diagram illustrating the arrangement of batches in a two-dimensional space, labeled with X and Y axes. The batches are organized in a grid-like structure, with batch numbers ranging from 0 to 29. The diagram also includes a visual representation of a border or margin around the batches, indicated by different fill patterns.
### Components/Axes
* **X-axis:** Horizontal axis, labeled "X" at the top.
* **Y-axis:** Vertical axis, labeled "y" on the left side.
* **Batches:** Rectangular cells arranged in a grid, each labeled with a batch number (0 to 29).
* **Border:** A region surrounding the batches, visually distinguished by a hatched pattern. The border has two layers: an outer layer with blue hatching and an inner layer with red hatching.
### Detailed Analysis
The batches are arranged in two columns. The left column contains batches 0 to 14, and the right column contains batches 15 to 29. Each batch is represented by a rectangle.
The border consists of two layers. The outer layer is filled with a blue hatched pattern, and the inner layer is filled with a red hatched pattern. The border surrounds the entire grid of batches.
The batches are arranged as follows:
| Left Column | Right Column |
| ----------- | ----------- |
| batch 0 | batch 15 |
| batch 1 | batch 16 |
| batch 2 | batch 17 |
| batch 3 | batch 18 |
| batch 4 | batch 19 |
| batch 5 | batch 20 |
| batch 6 | batch 21 |
| batch 7 | batch 22 |
| batch 8 | batch 23 |
| batch 9 | batch 24 |
| batch 10 | batch 25 |
| batch 11 | batch 26 |
| batch 12 | batch 27 |
| batch 13 | batch 28 |
| batch 14 | batch 29 |
### Key Observations
* The batches are arranged in a grid-like structure.
* The border consists of two layers with different fill patterns.
* The batch numbers are sequential within each column.
### Interpretation
The diagram likely represents a spatial arrangement of data or processes, where each batch corresponds to a specific unit of work or data. The X and Y axes could represent spatial coordinates or other relevant dimensions. The border might indicate a buffer zone or a region of special processing. The two-layered border could represent different levels of buffering or processing. The arrangement of batches in two columns might indicate a parallel processing scheme or a division of labor. The diagram provides a visual representation of how these batches are organized and related to each other within a defined space.