\n
## Data Table: Batch Identification
### Overview
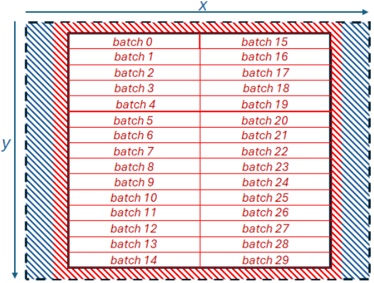
The image presents a data table organized into rows and columns, representing batches identified by numerical indices. The table is framed by a red border and a blue, diagonally-striped border. Axes 'x' and 'y' are indicated on the top-right and left sides, respectively.
### Components/Axes
* **X-axis:** Labeled "X", positioned at the top-right of the table.
* **Y-axis:** Labeled "Y", positioned on the left side of the table.
* **Table Structure:** The table consists of 15 rows and 2 columns.
* **Column Headers:** The first row contains the column headers: "batch 0" to "batch 14" in the left column, and "batch 15" to "batch 29" in the right column.
* **Border:** A red border surrounds the entire table. A blue, diagonally-striped border surrounds the red border.
### Detailed Analysis or Content Details
The table contains the following batch identifiers:
| Column 1 | Column 2 |
|---|---|
| batch 0 | batch 15 |
| batch 1 | batch 16 |
| batch 2 | batch 17 |
| batch 3 | batch 18 |
| batch 4 | batch 19 |
| batch 5 | batch 20 |
| batch 6 | batch 21 |
| batch 7 | batch 22 |
| batch 8 | batch 23 |
| batch 9 | batch 24 |
| batch 10 | batch 25 |
| batch 11 | batch 26 |
| batch 12 | batch 27 |
| batch 13 | batch 28 |
| batch 14 | batch 29 |
### Key Observations
The table presents a sequential listing of batches, numbered from 0 to 29. The batches are organized into two columns, with the first column containing batches 0-14 and the second column containing batches 15-29. The table structure suggests a potential grouping or categorization of batches.
### Interpretation
The data suggests a system for identifying and tracking batches, possibly in a manufacturing, processing, or experimental context. The two-column arrangement might indicate a division of batches based on some criteria (e.g., production date, material type, experimental condition). The presence of the 'X' and 'Y' axes, while not directly used for numerical data, could imply a coordinate system or spatial arrangement related to the batches. The red and blue borders may indicate different stages or classifications within the batch tracking process. Without further context, the specific meaning of the batch numbers and their arrangement remains unclear. The table itself is a simple organizational tool, and its significance depends on the broader system it is part of.