## Grid Layout Diagram: Batch Organization Structure
### Overview
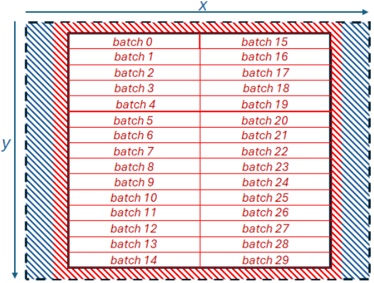
The image depicts a structured grid layout organizing 30 batches (batch 0 to batch 29) into a 15x2 matrix. The grid is enclosed by a red diagonal stripe border with a blue diagonal stripe border inside it. Axes labeled "X" (horizontal) and "Y" (vertical) define the grid's orientation. Each cell contains a single "batch X" label, with sequential numbering across rows and columns.
### Components/Axes
- **Axes**:
- Horizontal axis labeled "X" with a rightward arrow.
- Vertical axis labeled "Y" with a downward arrow.
- **Grid Structure**:
- 15 rows (Y-axis) and 2 columns (X-axis).
- Red diagonal stripe border (outer) and blue diagonal stripe border (inner).
- **Labels**:
- Each cell contains a "batch X" label (X = 0–29).
- No explicit legend or colorbar present.
### Detailed Analysis
- **Batch Distribution**:
- **Column 1 (Left)**: Batches 0–14 (rows 1–15).
- **Column 2 (Right)**: Batches 15–29 (rows 1–15).
- **Border Design**:
- Outer red diagonal stripes (top-left to bottom-right).
- Inner blue diagonal stripes (top-right to bottom-left).
- **Grid Lines**:
- Thin red horizontal/vertical lines separate cells.
- **Text Placement**:
- Labels centered within cells.
- Axis labels positioned at the top (X) and left (Y) of the grid.
### Key Observations
1. **Sequential Batching**: Batches are numbered consecutively, suggesting a linear workflow or processing order.
2. **Dual-Column Structure**: The 2-column layout may imply parallel processing or paired operations (e.g., batch 0 paired with batch 15).
3. **Border Symbolism**: Red/blue diagonal stripes could denote boundaries or zones, but no legend clarifies their meaning.
4. **No Numerical Data**: The grid lacks quantitative values (e.g., metrics, timestamps), focusing solely on categorical organization.
### Interpretation
The diagram likely represents a workflow or data partitioning strategy:
- **Parallel Processing**: The 2-column layout might indicate concurrent execution of batches (e.g., batches 0–14 and 15–29 processed simultaneously).
- **Sequential Dependency**: The row-wise numbering (batch 0 to 29) suggests a linear progression, possibly for training epochs or iterative tasks.
- **Boundary Zones**: The red/blue borders may symbolize input/output regions or error-handling zones, though this is speculative without a legend.
- **Limitation**: The absence of a legend or axis scales leaves the purpose of the borders and grid structure open to interpretation.
## Conclusion
This grid layout emphasizes categorical organization over quantitative analysis. The dual-column structure and sequential batch numbering imply a hybrid approach to processing, balancing parallelism with order. Further context (e.g., system architecture, workflow rules) would be needed to fully decode the red/blue border symbolism.