\n
## Bar Chart: Accuracy vs. Prompting Method with Error Consideration
### Overview
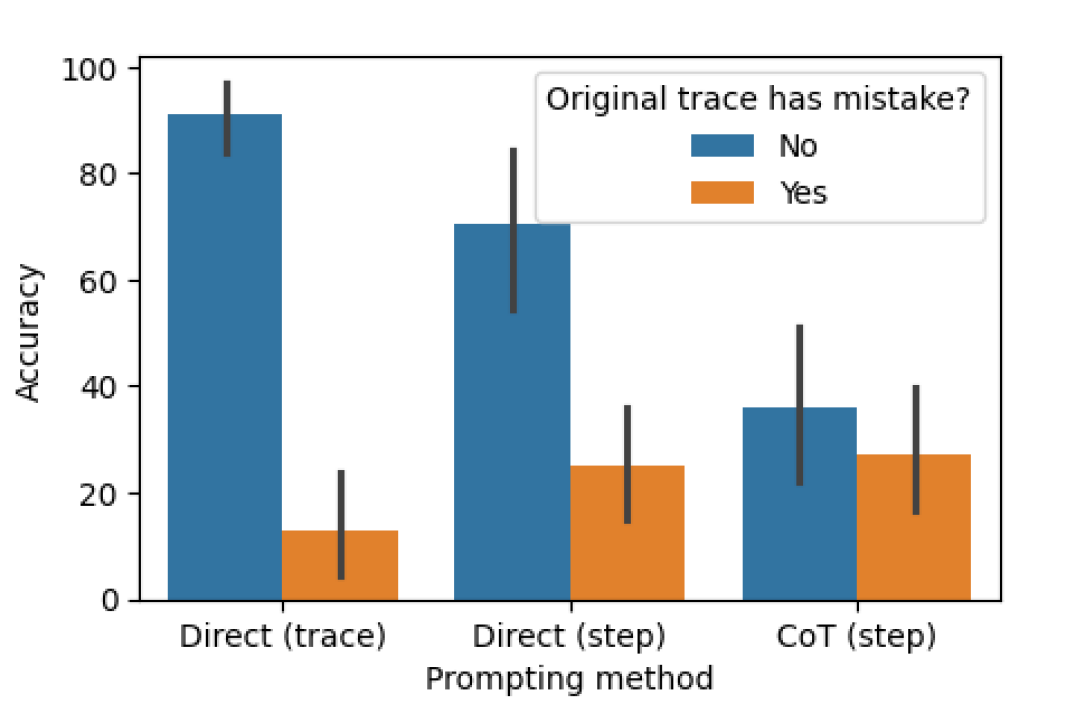
This bar chart compares the accuracy of different prompting methods ("Direct (trace)", "Direct (step)", and "CoT (step)") in relation to whether the original trace contained a mistake ("No" or "Yes"). The chart uses bar heights to represent accuracy, with error bars indicating variability.
### Components/Axes
* **X-axis:** "Prompting method" with categories: "Direct (trace)", "Direct (step)", "CoT (step)".
* **Y-axis:** "Accuracy" ranging from 0 to 100, with increments of 20.
* **Legend:** "Original trace has mistake?" with labels "No" (represented by blue color) and "Yes" (represented by orange color).
* **Error Bars:** Vertical lines extending above and below each bar, indicating the range of accuracy.
### Detailed Analysis
The chart consists of six bars, grouped by prompting method and error status.
* **Direct (trace):**
* "No" (Blue): The accuracy is approximately 92 ± 8. The bar is tall and centered over "Direct (trace)" on the x-axis.
* "Yes" (Orange): The accuracy is approximately 15 ± 10. The bar is short and centered over "Direct (trace)" on the x-axis.
* **Direct (step):**
* "No" (Blue): The accuracy is approximately 72 ± 8. The bar is tall and centered over "Direct (step)" on the x-axis.
* "Yes" (Orange): The accuracy is approximately 25 ± 8. The bar is short and centered over "Direct (step)" on the x-axis.
* **CoT (step):**
* "No" (Blue): The accuracy is approximately 36 ± 10. The bar is medium height and centered over "CoT (step)" on the x-axis.
* "Yes" (Orange): The accuracy is approximately 22 ± 8. The bar is short and centered over "CoT (step)" on the x-axis.
The error bars are of varying lengths, indicating different levels of uncertainty in the accuracy measurements.
### Key Observations
* The "Direct (trace)" method performs best when the original trace has no mistakes, achieving the highest accuracy (around 92%).
* Accuracy significantly drops for all methods when the original trace contains a mistake.
* The "CoT (step)" method consistently shows the lowest accuracy, regardless of whether the original trace has a mistake.
* The error bars suggest greater uncertainty in the accuracy estimates for the "CoT (step)" method, particularly when the original trace has no mistakes.
### Interpretation
The data suggests that the "Direct (trace)" prompting method is most reliable when the underlying data is correct. However, all methods are susceptible to errors when the original trace contains mistakes. The "CoT (step)" method appears to be the least effective overall, potentially indicating that the chain-of-thought approach doesn't improve accuracy in this context, and may even introduce more variability. The large drop in accuracy when the original trace has a mistake highlights the importance of data quality and error detection in the initial stages of the process. The error bars indicate that the accuracy measurements are not precise, and further investigation with larger sample sizes may be needed to confirm these findings. The chart demonstrates a clear trade-off between prompting method and the presence of errors in the original trace.