## Bar Chart: Prompt Length vs. Average Success Rate
### Overview
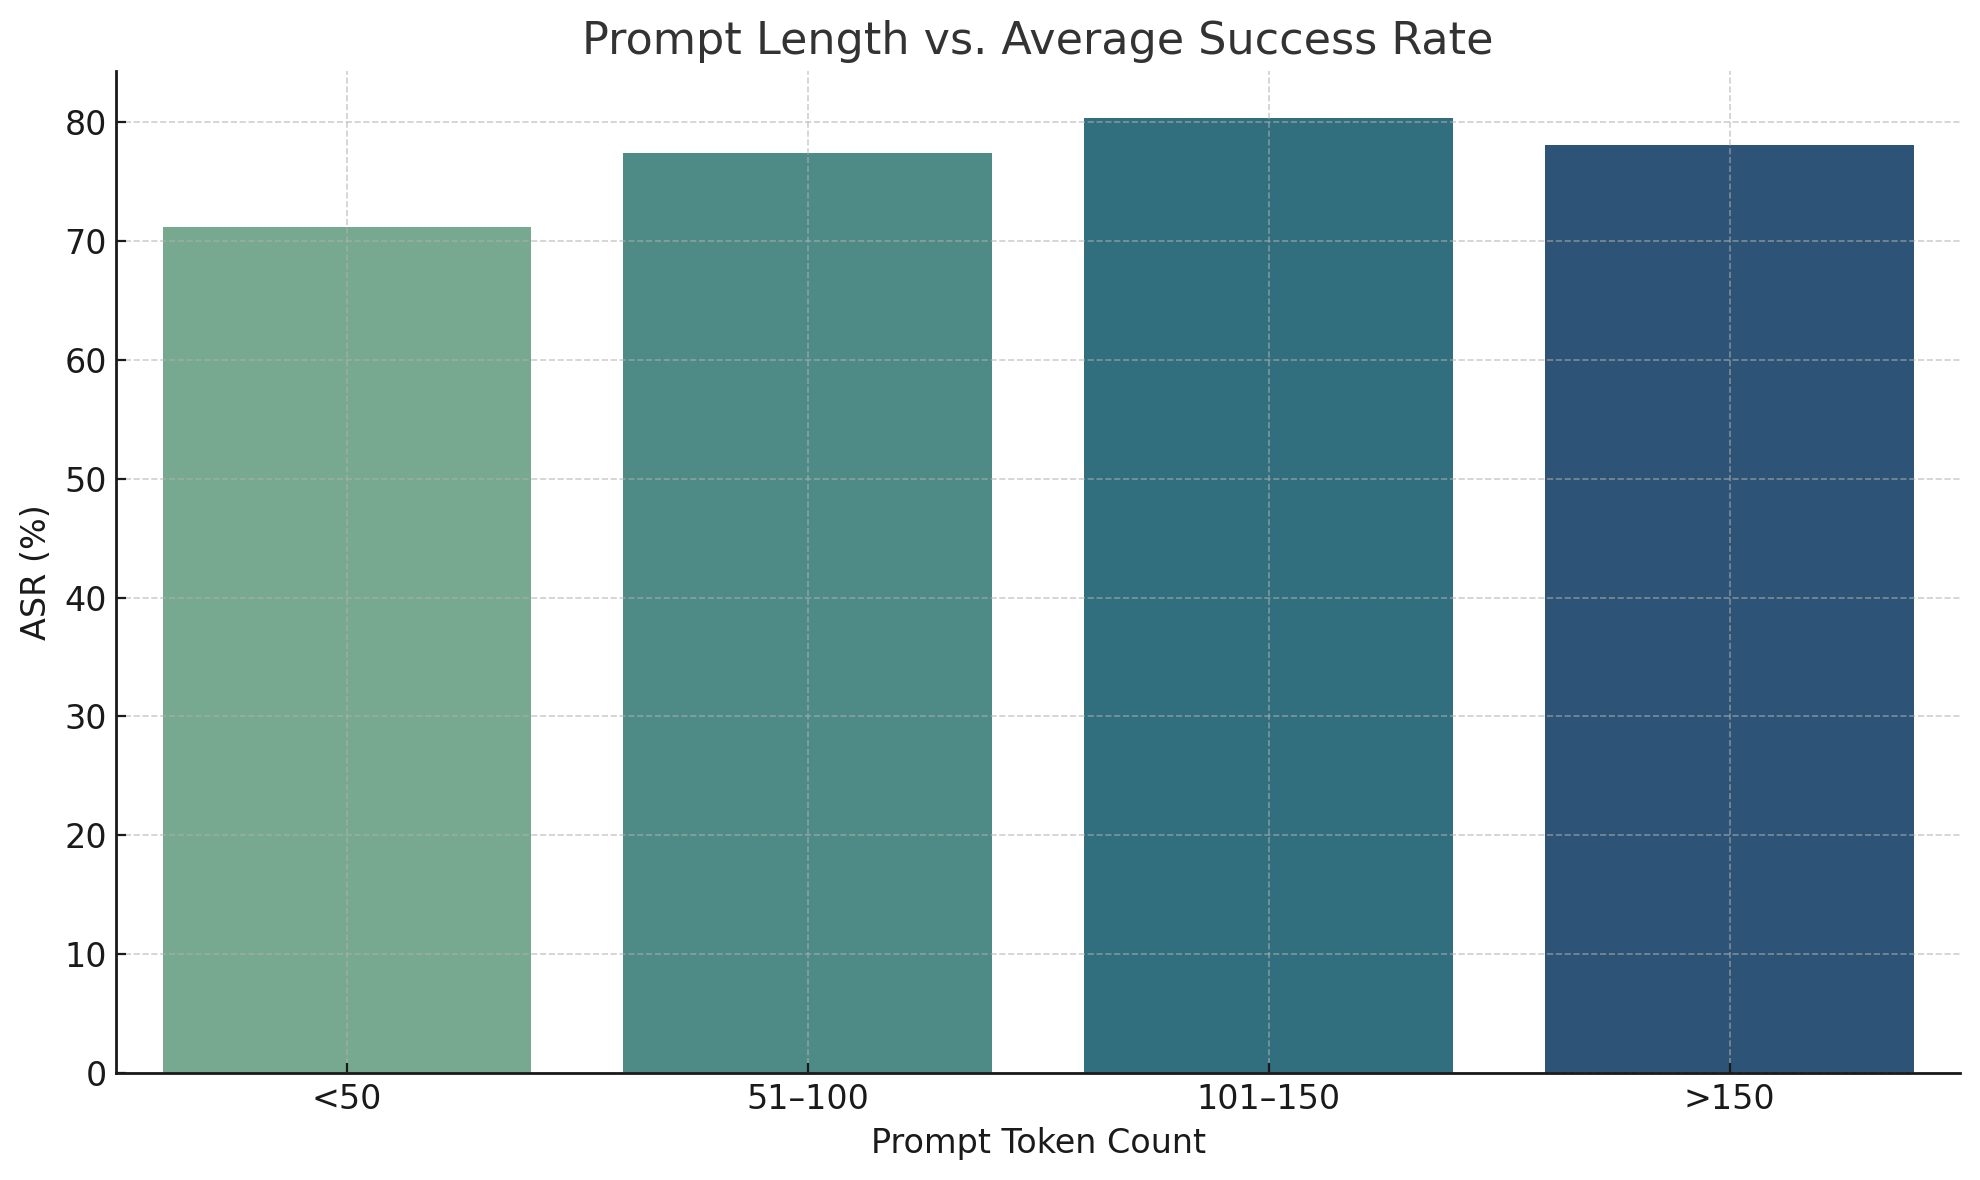
The image is a bar chart comparing prompt length (measured in token count) to the average success rate (ASR, measured in percentage). The chart displays four categories of prompt lengths: "<50", "51-100", "101-150", and ">150". The height of each bar represents the average success rate for prompts within that length category. The bars are colored in a gradient from light green to dark blue, with the shortest prompt length category being the lightest and the longest being the darkest.
### Components/Axes
* **Title:** Prompt Length vs. Average Success Rate
* **X-axis:** Prompt Token Count
* Categories: <50, 51-100, 101-150, >150
* **Y-axis:** ASR (%)
* Scale: 0 to 80, with tick marks at intervals of 10.
### Detailed Analysis
* **Category <50:** The bar is light green. The ASR is approximately 71%.
* **Category 51-100:** The bar is a medium teal color. The ASR is approximately 77%.
* **Category 101-150:** The bar is a darker teal color. The ASR is approximately 80%.
* **Category >150:** The bar is dark blue. The ASR is approximately 78%.
### Key Observations
* The average success rate generally increases as the prompt length increases from "<50" to "101-150".
* The highest average success rate is observed for prompts with a token count between 101 and 150.
* The average success rate decreases slightly for prompts with a token count greater than 150, compared to the 101-150 range.
### Interpretation
The data suggests that there is a positive correlation between prompt length and average success rate, up to a certain point. Prompts with a token count between 101 and 150 appear to have the highest success rate. However, very long prompts (greater than 150 tokens) may not be as effective as prompts in the 101-150 range. This could be due to factors such as increased complexity or redundancy in longer prompts. The optimal prompt length, based on this data, appears to be in the 101-150 token range.