\n
## Bar Chart: Prompt Length vs. Average Success Rate
### Overview
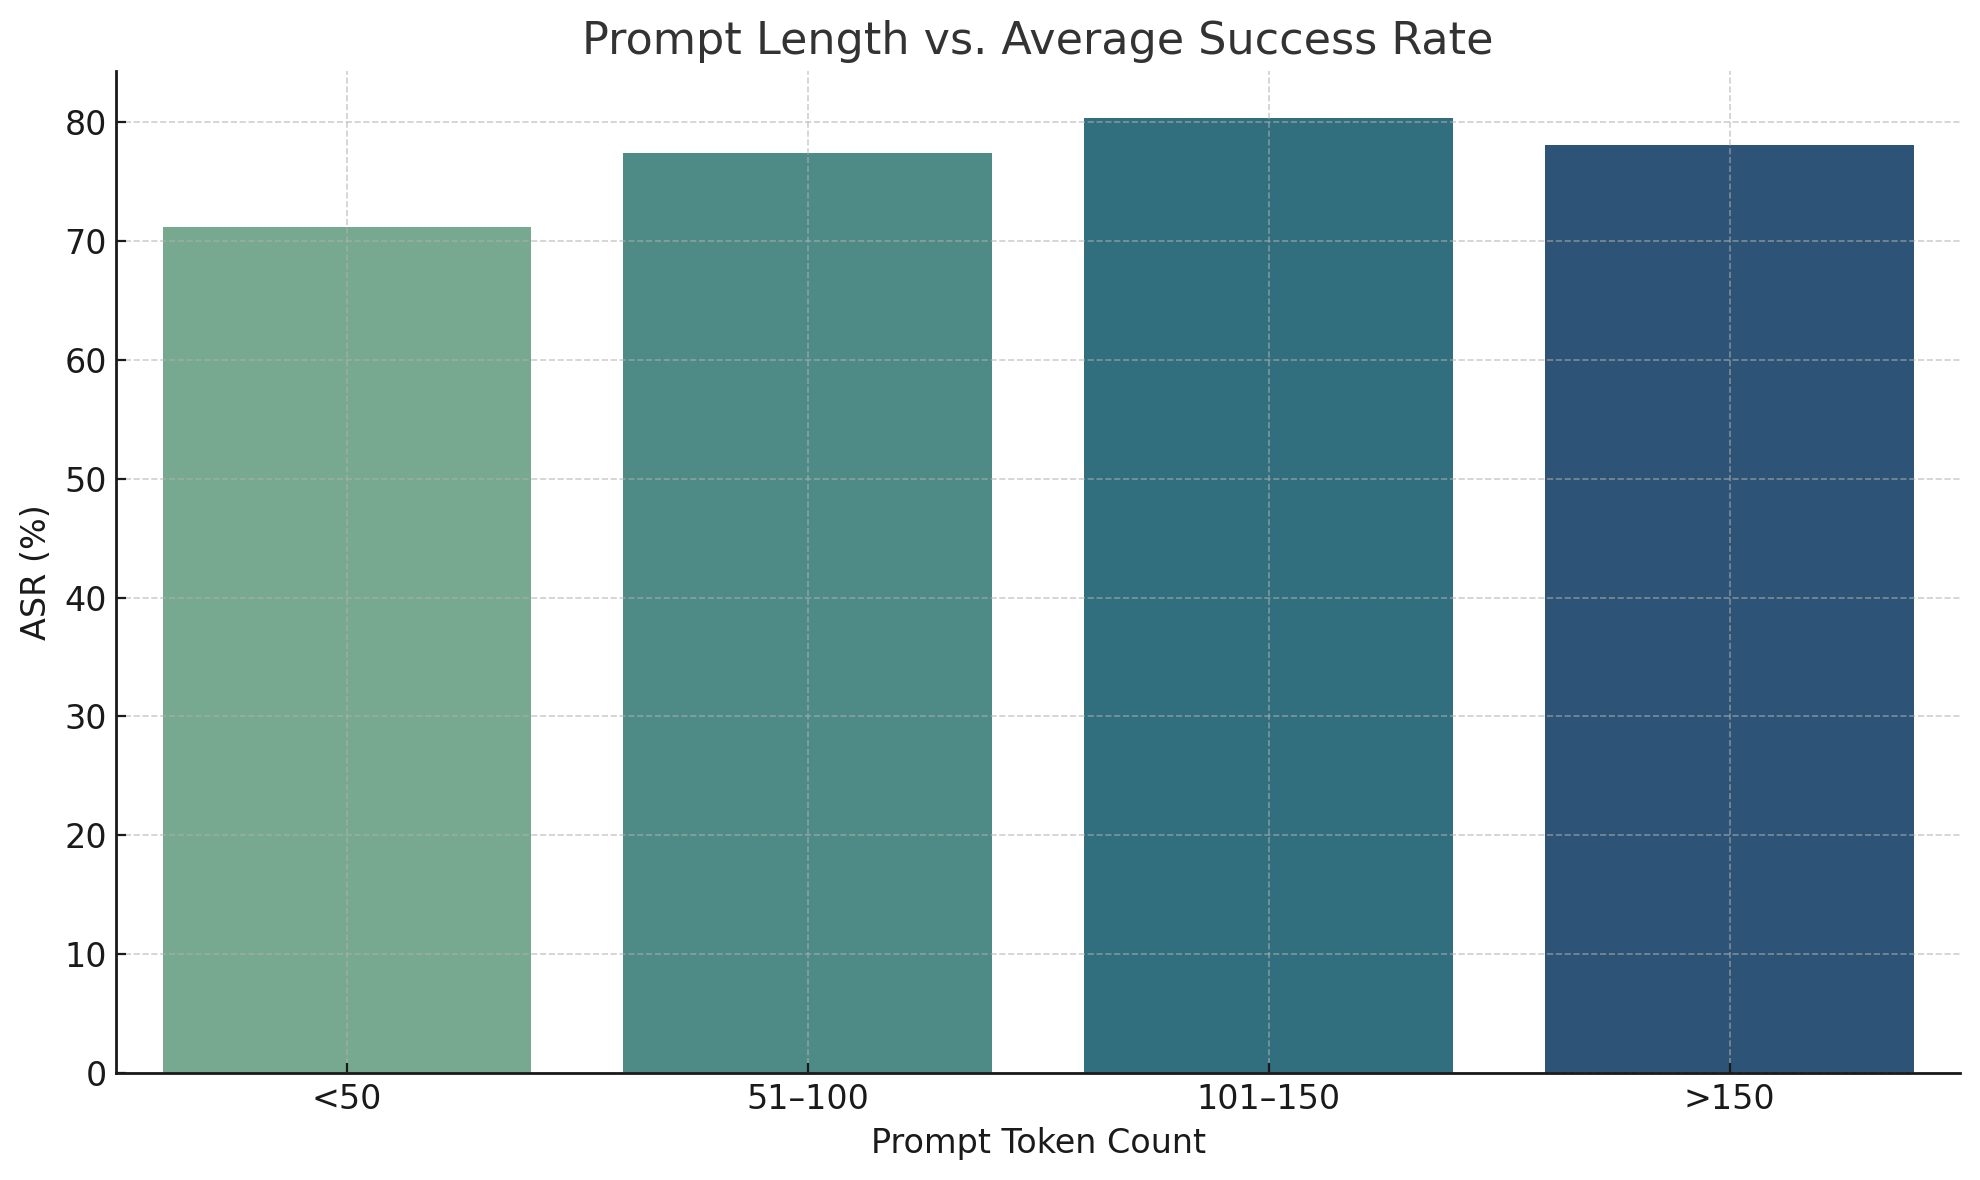
This bar chart illustrates the relationship between prompt length (measured in token count) and the average success rate (ASR) achieved. The chart displays four bars, each representing a different range of prompt token counts. The height of each bar corresponds to the average success rate for prompts within that token count range.
### Components/Axes
* **Title:** "Prompt Length vs. Average Success Rate" - positioned at the top-center of the chart.
* **X-axis:** "Prompt Token Count" - displays four categories: "<50", "51-100", "101-150", and ">150".
* **Y-axis:** "ASR (%)" - represents the Average Success Rate, with a scale ranging from 0 to 80, incrementing by 10.
* **Bars:** Four bars representing the ASR for each prompt token count range. The bars are colored in shades of green and blue, transitioning from lighter to darker as the token count increases.
### Detailed Analysis
* **<50 Tokens:** The bar for prompts with less than 50 tokens has a height of approximately 68%. The bar is a light green color.
* **51-100 Tokens:** The bar for prompts with 51-100 tokens has a height of approximately 74%. The bar is a medium green color.
* **101-150 Tokens:** The bar for prompts with 101-150 tokens has a height of approximately 79%. The bar is a light blue color.
* **>150 Tokens:** The bar for prompts with more than 150 tokens has a height of approximately 76%. The bar is a dark blue color.
The bars generally increase in height from "<50" to "101-150", then slightly decrease for ">150".
### Key Observations
* The highest average success rate is observed for prompts with 101-150 tokens (approximately 79%).
* The lowest average success rate is observed for prompts with less than 50 tokens (approximately 68%).
* There is a slight decrease in average success rate for prompts exceeding 150 tokens, compared to the 101-150 token range.
### Interpretation
The data suggests that there is an optimal prompt length for maximizing success rate. Prompts within the 101-150 token range appear to perform best. Shorter prompts (<50 tokens) may lack sufficient detail or context, leading to lower success rates. While longer prompts (>150 tokens) still achieve a relatively high success rate, the slight decrease suggests that excessive length may introduce noise or redundancy, potentially hindering performance.
The relationship is not strictly linear; it appears to have a peak around the 101-150 token range. This could indicate that the model benefits from a certain level of detail and instruction, but beyond that point, additional information does not necessarily translate to improved results. Further investigation might explore the impact of prompt content and structure within these token ranges to refine the optimal prompt length strategy.