\n
## Line Chart: Food Amount vs. Step Number for Different Model Variants
### Overview
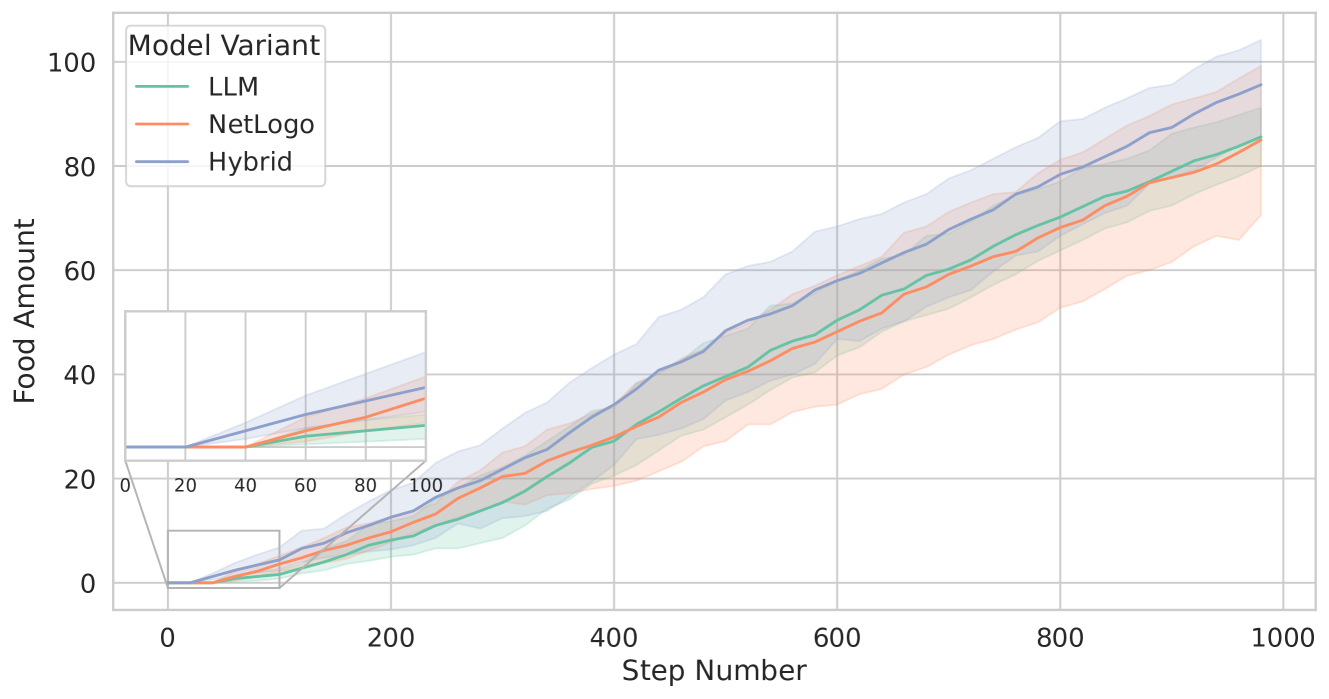
This line chart depicts the relationship between the step number and the food amount collected by three different model variants: LLM, NetLogo, and Hybrid. Each line represents the average food amount collected over 1000 steps, with shaded areas indicating the standard deviation around the mean. A zoomed-in section of the chart is also provided, focusing on the first 100 steps.
### Components/Axes
* **X-axis:** Step Number (ranging from 0 to 1000).
* **Y-axis:** Food Amount (ranging from 0 to 100).
* **Legend:** Located in the top-left corner, identifying the three model variants and their corresponding line colors:
* LLM (Light Blue)
* NetLogo (Orange)
* Hybrid (Green)
* **Zoomed-in Chart:** Located in the bottom-left corner, displaying the data from Step 0 to Step 100.
* **Gridlines:** Present throughout the chart to aid in reading values.
### Detailed Analysis
**LLM (Light Blue):** The LLM line slopes upward consistently throughout the 1000 steps.
* At Step 0, the food amount is approximately 2.
* At Step 100, the food amount is approximately 22.
* At Step 200, the food amount is approximately 32.
* At Step 400, the food amount is approximately 52.
* At Step 600, the food amount is approximately 66.
* At Step 800, the food amount is approximately 78.
* At Step 1000, the food amount is approximately 86.
* The shaded area around the line indicates a standard deviation that increases with the step number, becoming wider at higher step values.
**NetLogo (Orange):** The NetLogo line also slopes upward, but appears to have a slightly steeper initial slope than the LLM line.
* At Step 0, the food amount is approximately 1.
* At Step 100, the food amount is approximately 20.
* At Step 200, the food amount is approximately 30.
* At Step 400, the food amount is approximately 50.
* At Step 600, the food amount is approximately 64.
* At Step 800, the food amount is approximately 76.
* At Step 1000, the food amount is approximately 84.
* The shaded area around the line is relatively consistent throughout the 1000 steps.
**Hybrid (Green):** The Hybrid line shows a similar upward trend, but starts with a lower food amount and appears to plateau slightly before Step 800.
* At Step 0, the food amount is approximately 0.
* At Step 100, the food amount is approximately 15.
* At Step 200, the food amount is approximately 25.
* At Step 400, the food amount is approximately 45.
* At Step 600, the food amount is approximately 58.
* At Step 800, the food amount is approximately 72.
* At Step 1000, the food amount is approximately 80.
* The shaded area around the line is wider in the initial steps and narrows as the step number increases.
**Zoomed-in Chart:** The zoomed-in chart confirms the initial trends observed in the main chart, showing the LLM and NetLogo lines starting slightly above the Hybrid line.
### Key Observations
* All three model variants demonstrate an increasing trend in food amount as the step number increases.
* The NetLogo model appears to collect food slightly faster than the LLM model in the initial stages.
* The Hybrid model starts with the lowest food amount but catches up to the other models over time.
* The standard deviation around the mean varies for each model, indicating different levels of consistency in food collection.
### Interpretation
The chart suggests that all three model variants are capable of learning to collect food over time. The differences in their performance may be attributed to the underlying algorithms and strategies employed by each model. The NetLogo model's initial advantage could be due to its simpler, more direct approach to food collection. The Hybrid model's slower start may indicate a longer learning curve, but its ability to catch up suggests that it can eventually achieve comparable performance. The standard deviation values provide insights into the robustness of each model's performance, with lower standard deviations indicating more consistent results. The zoomed-in chart highlights the initial differences in performance, providing a more detailed view of the learning process in the early stages. The overall trend indicates that the models are successfully adapting to the environment and improving their food collection efficiency over time.