## Line Graph: Model Variant Performance Over Steps
### Overview
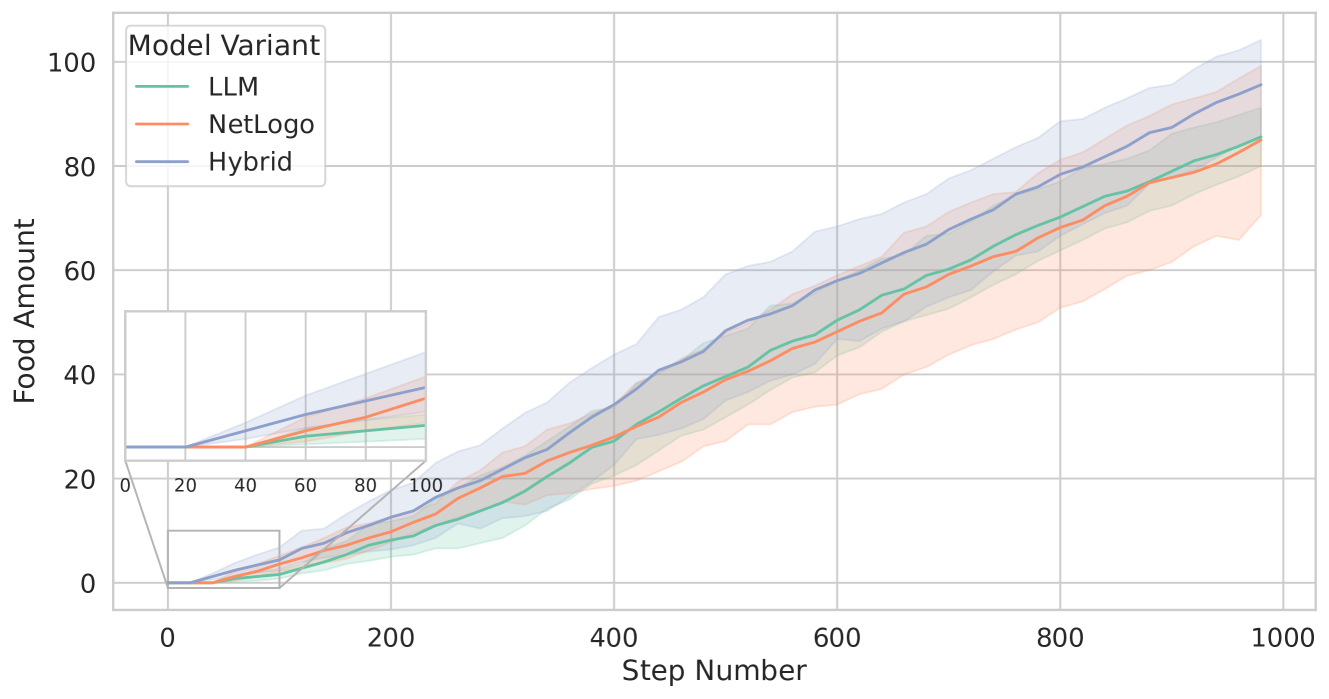
The image depicts a line graph comparing the performance of three computational models (LLM, NetLogo, Hybrid) in terms of "Food Amount" accumulated over "Step Number." The graph includes a main plot and an inset zoomed-in view of the first 100 steps. All models show upward trends, with shaded regions indicating variability or confidence intervals.
### Components/Axes
- **X-axis (Step Number)**: Ranges from 0 to 1000 in increments of 200. Labeled "Step Number."
- **Y-axis (Food Amount)**: Ranges from 0 to 100 in increments of 20. Labeled "Food Amount."
- **Legend**: Located in the top-left corner, associating:
- **Green line**: LLM
- **Orange line**: NetLogo
- **Blue line**: Hybrid
- **Inset Graph**: Positioned in the bottom-left corner, showing a magnified view of steps 0–100 and food amounts 0–40.
### Detailed Analysis
1. **Main Chart Trends**:
- **Hybrid (Blue)**: Consistently the highest-performing model, reaching ~95 food units at step 1000. The line slopes steeply upward with moderate variability (shaded blue region).
- **NetLogo (Orange)**: Second-highest performance, reaching ~82 food units at step 1000. The line slopes upward but with greater variability than Hybrid (shaded orange region).
- **LLM (Green)**: Lowest performance, reaching ~85 food units at step 1000. The line slopes upward but with the least variability (narrowest shaded green region).
2. **Inset Graph (Steps 0–100)**:
- All models start near 0 food units at step 0.
- Hybrid gains the most food by step 100 (~22 units), followed by NetLogo (~18 units) and LLM (~15 units).
- Variability is minimal in the early steps, with Hybrid showing the steepest initial growth.
### Key Observations
- **Performance Divergence**: The Hybrid model outperforms others significantly by step 1000, while LLM lags behind despite similar early-step growth.
- **Variability**: Hybrid exhibits the widest confidence interval, suggesting higher uncertainty in its outcomes compared to LLM and NetLogo.
- **Early vs. Late Steps**: The inset reveals that performance gaps between models narrow in the first 100 steps but widen dramatically afterward.
### Interpretation
The data suggests that the Hybrid model combines strengths from LLM and NetLogo to optimize food accumulation more effectively. Its higher variability may indicate exploratory behavior or adaptive strategies that yield better long-term results. LLM’s consistent but lower performance implies limitations in scalability or efficiency. NetLogo’s intermediate performance suggests it balances exploration and exploitation better than LLM but less effectively than Hybrid. The widening gaps after step 100 highlight the importance of model architecture in sustained optimization tasks.