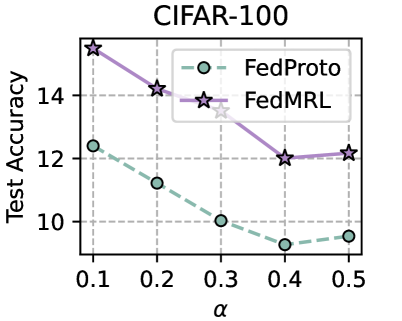
## Line Chart: CIFAR-100 Test Accuracy vs. α
### Overview
The chart compares the test accuracy of two machine learning methods (FedProto and FedMRL) across varying values of α (0.1 to 0.5) on the CIFAR-100 dataset. Test accuracy is measured on the y-axis (10–14), while α is plotted on the x-axis. Two distinct trends are observed: FedProto shows a steady decline, while FedMRL exhibits a sharp initial drop followed by stabilization.
### Components/Axes
- **X-axis (α)**: Labeled "α" with values 0.1, 0.2, 0.3, 0.4, 0.5.
- **Y-axis (Test Accuracy)**: Labeled "Test Accuracy" with values 10, 12, 14.
- **Legend**: Located in the top-right corner, with:
- **FedProto**: Dashed teal line with hollow circles.
- **FedMRL**: Solid purple line with star markers.
### Detailed Analysis
1. **FedProto (Teal Line)**:
- Starts at **~12.2** when α = 0.1.
- Declines steadily to **~9.8** at α = 0.5.
- Intermediate points: ~11.0 (α=0.2), ~10.0 (α=0.3), ~9.5 (α=0.4).
2. **FedMRL (Purple Line)**:
- Begins at **~15.0** when α = 0.1.
- Drops sharply to **~13.5** at α = 0.3.
- Stabilizes with a slight increase to **~12.5** at α = 0.5.
- Intermediate points: ~14.0 (α=0.2), ~13.5 (α=0.3), ~12.5 (α=0.5).
### Key Observations
- FedMRL consistently outperforms FedProto across all α values.
- FedProto’s decline is linear, while FedMRL’s performance plateaus after α = 0.3.
- The largest gap between methods occurs at α = 0.1 (~2.8 accuracy difference).
### Interpretation
The data suggests that FedMRL is more robust to changes in α, maintaining higher accuracy even as α increases. FedProto’s performance degrades linearly, indicating sensitivity to α. The stabilization of FedMRL at higher α values implies potential adaptability to model complexity or noise in the CIFAR-100 dataset. The sharp drop in FedMRL’s accuracy between α = 0.1 and 0.3 may reflect a threshold where model assumptions become less valid. These trends highlight the importance of tuning α for federated learning frameworks on non-IID datasets like CIFAR-100.