## Bayesian Network Diagram
### Overview
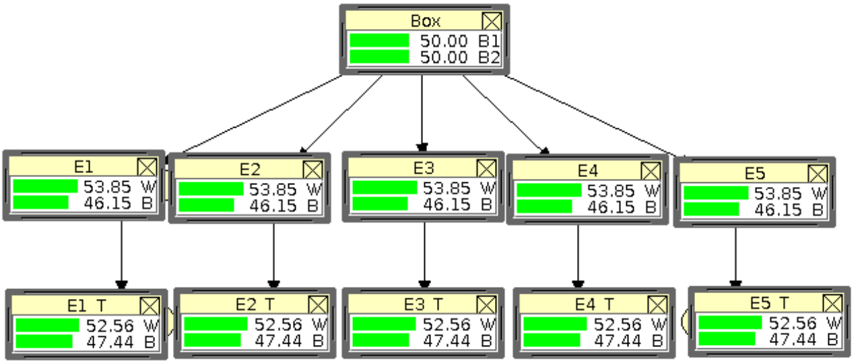
The image depicts a Bayesian network diagram, illustrating probabilistic relationships between variables. The network consists of nodes representing variables and directed edges representing dependencies. Each node contains a label and numerical values associated with different states or categories.
### Components/Axes
* **Nodes:** Rectangular boxes representing variables. Each node has a label (e.g., "Box", "E1", "E2", "E1 T", "E2 T") and displays numerical values associated with different states or categories.
* **Edges:** Directed arrows indicating probabilistic dependencies between variables.
* **Node Labels:** Text labels identifying each variable (e.g., "Box", "E1", "E2", "E3", "E4", "E5", "E1 T", "E2 T", "E3 T", "E4 T", "E5 T").
* **Numerical Values:** Each node displays numerical values associated with different states or categories. These values are represented as percentages or probabilities.
* For the "Box" node: "50.00 B1" and "50.00 B2".
* For nodes "E1" to "E5": "53.85 W" and "46.15 B".
* For nodes "E1 T" to "E5 T": "52.56 W" and "47.44 B".
* **State/Category Labels:** Labels associated with the numerical values, indicating the state or category (e.g., "B1", "B2", "W", "B").
* **Green Bars:** Horizontal green bars within each node visually represent the magnitude of the numerical values.
### Detailed Analysis or ### Content Details
**Node: Box**
* Located at the top-center of the diagram.
* Values:
* B1: 50.00
* B2: 50.00
**Nodes: E1, E2, E3, E4, E5**
* Located in the middle row of the diagram.
* Each node has the same values:
* W: 53.85
* B: 46.15
**Nodes: E1 T, E2 T, E3 T, E4 T, E5 T**
* Located in the bottom row of the diagram.
* Each node has the same values:
* W: 52.56
* B: 47.44
**Edges:**
* The "Box" node has directed edges pointing to each of the "E1" to "E5" nodes.
* Each of the "E1" to "E5" nodes has a directed edge pointing to the corresponding "E1 T" to "E5 T" nodes.
### Key Observations
* The "Box" node has two states, "B1" and "B2", with equal probabilities (50.00 each).
* The "E1" to "E5" nodes have the same probabilities for states "W" and "B" (53.85 and 46.15, respectively).
* The "E1 T" to "E5 T" nodes also have the same probabilities for states "W" and "B" (52.56 and 47.44, respectively).
* The probability of state "W" decreases slightly from the middle row (E1-E5) to the bottom row (E1 T - E5 T), while the probability of state "B" increases slightly.
### Interpretation
The Bayesian network diagram represents a probabilistic model where the state of the "Box" variable influences the states of the "E1" to "E5" variables, which in turn influence the states of the "E1 T" to "E5 T" variables. The equal probabilities of "B1" and "B2" in the "Box" node suggest an unbiased initial state. The slight shift in probabilities from "W" to "B" between the middle and bottom rows indicates a potential influence or transformation occurring between these stages. The diagram suggests a flow of probabilistic influence from the "Box" node down to the "E1 T" to "E5 T" nodes.