\n
## Diagram: Hierarchical Box Structure with Numerical Values
### Overview
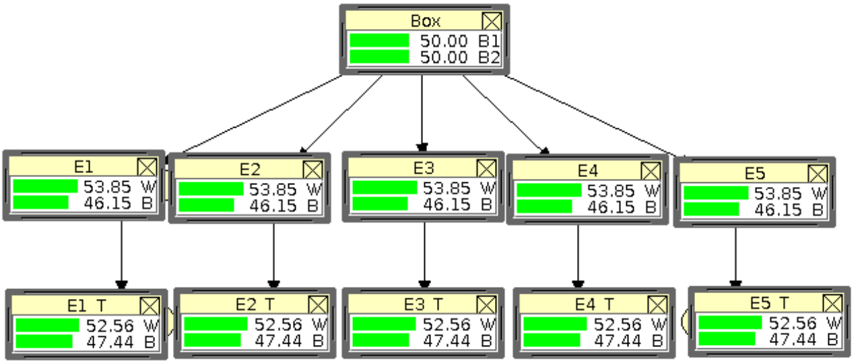
The image depicts a hierarchical diagram resembling a tree structure. A central "Box" element branches out into five "E" elements (E1-E5), which in turn each branch out into a corresponding "E T" element (E1 T - E5 T). Each box contains two numerical values and two letter labels. The diagram appears to represent a system with nested components and associated data.
### Components/Axes
The diagram consists of the following components:
* **Box:** The root element, labeled "Box".
* **E1-E5:** Five intermediate elements, labeled "E1", "E2", "E3", "E4", and "E5".
* **E1 T - E5 T:** Five terminal elements, labeled "E1 T", "E2 T", "E3 T", "E4 T", and "E5 T".
* **Numerical Values:** Each box contains two numerical values.
* **Letter Labels:** Each box contains two letter labels, "W" and "B".
* **Connecting Lines:** Lines connect the boxes, indicating a hierarchical relationship.
There are no explicit axes or scales in the traditional sense. The diagram's structure *is* the axis, showing levels of hierarchy.
### Detailed Analysis or Content Details
**Box:**
* Value 1: 50.00 (uncertainty in the hundredths place)
* Value 2: 50.00 (uncertainty in the hundredths place)
* Label 1: B1
* Label 2: B2
**E1:**
* Value 1: 53.85 (uncertainty in the hundredths place)
* Value 2: 46.15 (uncertainty in the hundredths place)
* Label 1: W
* Label 2: B
**E2:**
* Value 1: 53.85 (uncertainty in the hundredths place)
* Value 2: 46.15 (uncertainty in the hundredths place)
* Label 1: W
* Label 2: B
**E3:**
* Value 1: 53.85 (uncertainty in the hundredths place)
* Value 2: 46.15 (uncertainty in the hundredths place)
* Label 1: W
* Label 2: B
**E4:**
* Value 1: 53.85 (uncertainty in the hundredths place)
* Value 2: 46.15 (uncertainty in the hundredths place)
* Label 1: W
* Label 2: B
**E5:**
* Value 1: 53.85 (uncertainty in the hundredths place)
* Value 2: 46.15 (uncertainty in the hundredths place)
* Label 1: W
* Label 2: B
**E1 T:**
* Value 1: 52.56 (uncertainty in the hundredths place)
* Value 2: 47.44 (uncertainty in the hundredths place)
* Label 1: W
* Label 2: B
**E2 T:**
* Value 1: 52.56 (uncertainty in the hundredths place)
* Value 2: 47.44 (uncertainty in the hundredths place)
* Label 1: W
* Label 2: B
**E3 T:**
* Value 1: 52.56 (uncertainty in the hundredths place)
* Value 2: 47.44 (uncertainty in the hundredths place)
* Label 1: W
* Label 2: B
**E4 T:**
* Value 1: 52.56 (uncertainty in the hundredths place)
* Value 2: 47.44 (uncertainty in the hundredths place)
* Label 1: W
* Label 2: B
**E5 T:**
* Value 1: 52.56 (uncertainty in the hundredths place)
* Value 2: 47.44 (uncertainty in the hundredths place)
* Label 1: W
* Label 2: B
### Key Observations
* The "E" elements (E1-E5) all have the same numerical values and labels.
* The "E T" elements (E1 T - E5 T) also all have the same numerical values and labels.
* The values in the "E" elements are slightly higher than those in the "E T" elements.
* The diagram is symmetrical in terms of the branching structure.
* The "W" and "B" labels appear consistently across all boxes.
### Interpretation
The diagram likely represents a system where a central entity ("Box") distributes resources or processes to five sub-entities ("E1-E5"). Each sub-entity then further processes or distributes these resources to a corresponding set of terminal entities ("E1 T - E5 T").
The numerical values could represent quantities, percentages, or other metrics associated with each entity. The consistent values within each level of the hierarchy suggest a uniform distribution or processing pattern. The slight decrease in values from the "E" level to the "E T" level could indicate a loss or consumption of resources during the processing step.
The "W" and "B" labels could represent different types of resources, states, or categories. Their consistent presence across all boxes suggests they are fundamental attributes of the system.
The diagram's structure implies a hierarchical control flow, where the "Box" element governs the behavior of the "E" elements, which in turn govern the behavior of the "E T" elements. The symmetry of the structure suggests a balanced and predictable system. Without further context, the specific meaning of the values and labels remains speculative, but the diagram provides a clear visual representation of the system's organization and relationships.