## Hierarchical Diagram: Box Distribution and Transformation
### Overview
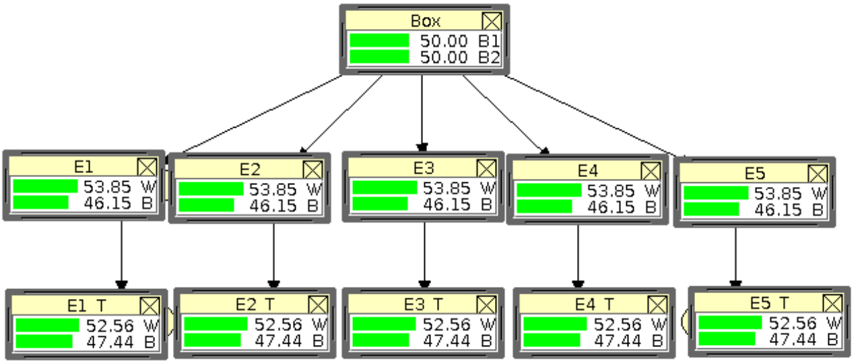
The image depicts a hierarchical structure with a central "Box" at the top, connected to five labeled boxes (E1-E5) via arrows. Each E-box has a corresponding T-box below it, forming a two-tiered system. Numerical values and color-coded bars (green for "W", black for "B") are present throughout.
### Components/Axes
- **Central Box**:
- Contains two green bars labeled "50.00 B1" and "50.00 B2".
- Positioned at the top-center, acting as the root node.
- **E-Boxes (E1-E5)**:
- Each has two green bars: "53.85 W" (top) and "46.15 B" (bottom).
- Connected directly to the central Box via arrows.
- **T-Boxes (E1T-E5T)**:
- Each has two green bars: "52.56 W" (top) and "47.44 B" (bottom).
- Connected to their respective E-boxes via arrows.
- **Arrows**:
- Black lines indicate directional flow from Box → E-boxes → T-boxes.
### Detailed Analysis
1. **Central Box**:
- Equal values for B1 and B2 (50.00 each).
- No "W" values present, only "B" (black) labels.
2. **E-Boxes**:
- All E-boxes share identical values:
- 53.85 W (green bar)
- 46.15 B (black bar)
- Positioned symmetrically around the central Box.
3. **T-Boxes**:
- All T-boxes share identical values:
- 52.56 W (green bar)
- 47.44 B (black bar)
- Positioned directly below their corresponding E-boxes.
4. **Color Coding**:
- Green bars consistently labeled "W" (possibly "Weight" or "West").
- Black bars consistently labeled "B" (possibly "Balance" or "Base").
### Key Observations
1. **Value Consistency**:
- All E-boxes and T-boxes share identical numerical values within their categories (W/B).
- Central Box is the only node with distinct B1/B2 labels.
2. **Value Shifts**:
- W values decrease from Box (50.00) → E-boxes (53.85) → T-boxes (52.56).
- B values increase from Box (50.00) → E-boxes (46.15) → T-boxes (47.44).
3. **Structural Symmetry**:
- Perfectly mirrored layout with five identical E-box/T-box pairs.
- Arrows form a strict top-down hierarchy.
### Interpretation
This diagram appears to model a **resource distribution system** with three stages:
1. **Source (Box)**: Equal allocation of two resources (B1/B2).
2. **Transformation (E-boxes)**: Conversion of resources into W/B metrics with specific ratios (53.85W/46.15B).
3. **Final Output (T-boxes)**: Slight adjustment of W/B values, maintaining the same ratio but with reduced absolute values.
The consistent use of W/B across all nodes suggests a standardized conversion process. The central Box's equal B1/B2 allocation contrasts with the E-boxes' skewed W/B distribution, implying an initial balanced state that becomes imbalanced through transformation. The T-boxes' values (52.56W/47.44B) represent a "corrected" or "optimized" state compared to the E-boxes, though the exact nature of this adjustment remains unclear without additional context.
Notable patterns include the preservation of value relationships across tiers (W always > B) and the strict hierarchical flow enforced by arrow directions. The absence of variability in node values suggests this may represent an idealized or theoretical model rather than real-world data.